
On October 4, 2026, the FAA held 13 airports in the United States under 15 active delay programs. The worst-hit airport was Boston Logan International (BOS) with a peak maximum delay of 1,439 minutes recorded during a ground delay program.
Delay Program Details Across Affected Airports
Delay programs on this day included two ground stop programs, where departures bound for an airport are held on the ground at their origin to manage traffic, and five ground delay programs, which assign later departure times to meter arrivals. The remaining eight programs were general arrival/departure delay information notices without specific traffic management tools.
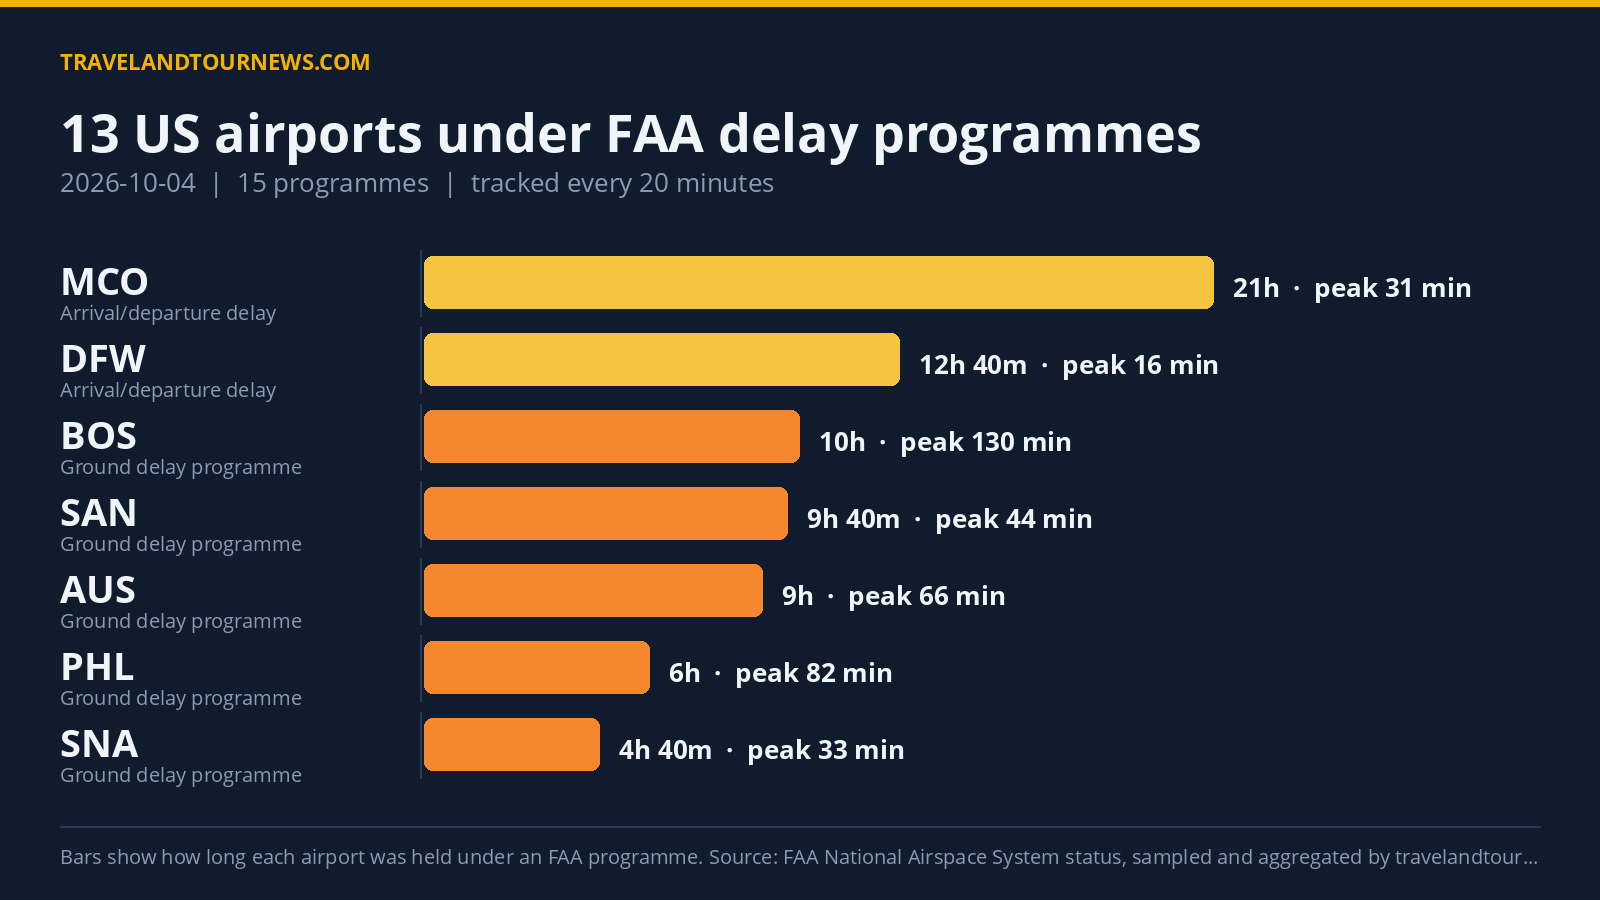
The longest delay program ran for 21 hours at Orlando International (MCO), showing general delay information related to thunderstorms and traffic management initiatives. Boston Logan’s ground delay program, focused on low ceilings, lasted 10 hours with an average peak delay of 130 minutes. Philadelphia International
(PHL) experienced a six-hour ground delay program also due to low ceilings, with average peak delays of 82 minutes.
At Austin (AUS), a nine-hour ground delay program cited low ceilings with a peak average delay of 66 minutes. San Diego International (SAN) had a 9 hour 40 minute ground delay program related to airport volume delays peaking at 44 minutes on average. Santa Ana (SNA) was unique in having both a 40-minute ground stop due to an air show and a subsequent 4 hour 40 minute ground delay program for the same cause, peaking at 33 minutes average delay.
The
ground stop program with the longest continuous duration was at Teterboro Airport (TEB), lasting two hours late in the day due to low ceilings, although no average or maximum delays were recorded. Several other general delay programs provided updates on weather conditions and runway construction affecting airports including Hartsfield-Jackson Atlanta (ATL), Dallas Love Field (DAL), Dallas/Fort Worth (DFW), Seattle-Tacoma (SEA), Harry Reid International (LAS), and Newark Liberty (EWR).
| Airport | FAA programme | Cause | Peak average delay | In force (UTC) |
|---|---|---|---|---|
| TEB | Ground Stop Programs | low ceilings | – | 20:40 to 22:40 (2 hours) |
| SNA | Ground Stop Programs | air show | – | 16:40 to 17:20 (40 minutes) |
| Boston Logan International (BOS) | Ground Delay Programs | low ceilings | 130 min | 12:40 to 22:40 (10 hours) |
| Philadelphia International (PHL) | Ground Delay Programs | low ceilings | 82 min | 16:40 to 22:40 (6 hours) |
| AUS | Ground Delay Programs | low ceilings | 66 min | 13:40 to 22:40 (9 hours) |
| San Diego International (SAN) | Ground Delay Programs | airport volume | 44 min | 13:00 to 22:40 (9 hours 40 minutes) |
| SNA | Ground Delay Programs | air show | 33 min | 17:40 to 22:20 (4 hours 40 minutes) |
| Hartsfield-Jackson Atlanta International (ATL) | General Arrival/Departure Delay Info | WX:Thunderstorms | 61 min | 20:20 to 22:20 (2 hours) |
| Orlando International (MCO) | General Arrival/Departure Delay Info | WX:Thunderstorms; TM Initiatives:MIT:WX | 31 min | 00:00 to 21:00 (21 hours) |
| Dallas Love Field (DAL) | General Arrival/Departure Delay Info | WX:Thunderstorms | 31 min | 14:40 to 15:40 (1 hour) |
| Dallas/Fort Worth International (DFW) | General Arrival/Departure Delay Info | TM INITIATIVES:STOP:DTO ARRIVALS; WX:Thunderstorms; OTHER:Aircraft Emergency | 16 min | 02:00 to 14:40 (12 hours 40 minutes) |
| Seattle-Tacoma International (SEA) | General Arrival/Departure Delay Info | WX:Low Visibility; RWY:Construction | 16 min | 16:00 to 20:00 (4 hours) |
| TEB | General Arrival/Departure Delay Info | VOL:Volume | 16 min | 14:40 to 16:00 (1 hour 20 minutes) |
| Harry Reid International (LAS) | General Arrival/Departure Delay Info | WX:Wind; VOL:Volume | 16 min | 16:40 to 17:40 (1 hour) |
Low Ceilings and Weather Dominated Delay Causes
Weather-related causes dominated delay programs on October 4. Low ceilings was the most frequent reason given, driving 85 instances of delay across multiple airports, particularly those under ground delay programs such as
Boston Logan, Philadelphia, Austin, and Teterboro.
Other leading causes included airport volume, cited in 30 instances related to San Diego and Teterboro delays. An air show caused 18 delay instances at Santa Ana’s ground stop and delay programs. Thunderstorms appeared as a significant factor in 16 delay instances impacting Atlanta, Orlando, Dallas Love Field, and Dallas/Fort Worth. Low visibility and wind conditions also contributed, particularly at Seattle and Harry Reid International airports.
Comparison With Previous Day and Recent Averages
Compared to October 3, 2026, there was a modest increase of three delay programs nationwide, from 14 to 15, and the number of airports affected rose from 10
to 13. The current day fell slightly below the recent 7-day average of 14.1 airports affected, indicating a stable, though slightly elevated, level of air traffic management activity. This day was not the worst in the recent tracking window.
All figures and causes are based on FAA data tracked and aggregated by travelandtournews.com.
Methodology. travelandtournews.com samples the FAA’s National Airspace System status feed every 20 minutes throughout the US operating day and aggregates the result. This report is built from 68 samples taken between 00:00 and 22:40 UTC on 2026-10-04. Durations are the observed window between the first and last
sample in which a programme was in force, so a programme’s true length may be slightly longer than shown. Ground stops, ground delay programmes, airport closures and general delays are all published by the FAA in real time; the daily aggregation is ours.