
The Federal Aviation Administration’s (FAA) official data tracked by travelandtournews.com shows that on August 21, 2026, 25 U.S. airports were under delay programs, with a total of 37 active delay programmes. Charlotte Douglas International Airport (CLT) was the worst affected, experiencing a ground stop due to thunderstorms lasting 10 hours.
Delay Programmes Active at 25 Airports Including Extensive Ground Stops and Delays
Among the 37 programmes, there were 10 Ground Stop Programs, which hold departures at their origin from going to the affected airports, 8 Ground Delay Programs that meter arrivals by assigning later departure times, and 19 programs reporting general arrival or departure delay information.
Charlotte Douglas International (CLT) experienced the longest ground stop program, active from 12:40 to 22:40 UTC, spanning 600 minutes (10 hours) due to thunderstorms. Chicago O’Hare (ORD) had a ground stop running for 5 hours and 20 minutes, also for thunderstorms. John F. Kennedy International (JFK) had two delay types: a ground stop lasting 3 hours
and 40 minutes early in the day starting at midnight, and a ground delay program lasting 40 minutes, both linked to thunderstorms.
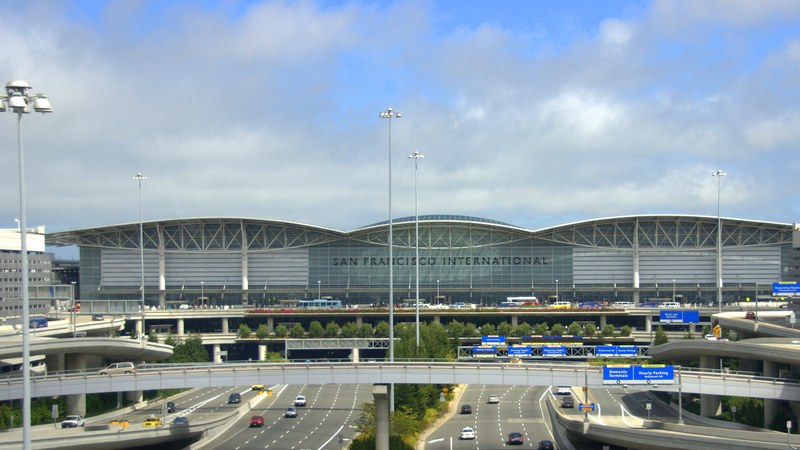
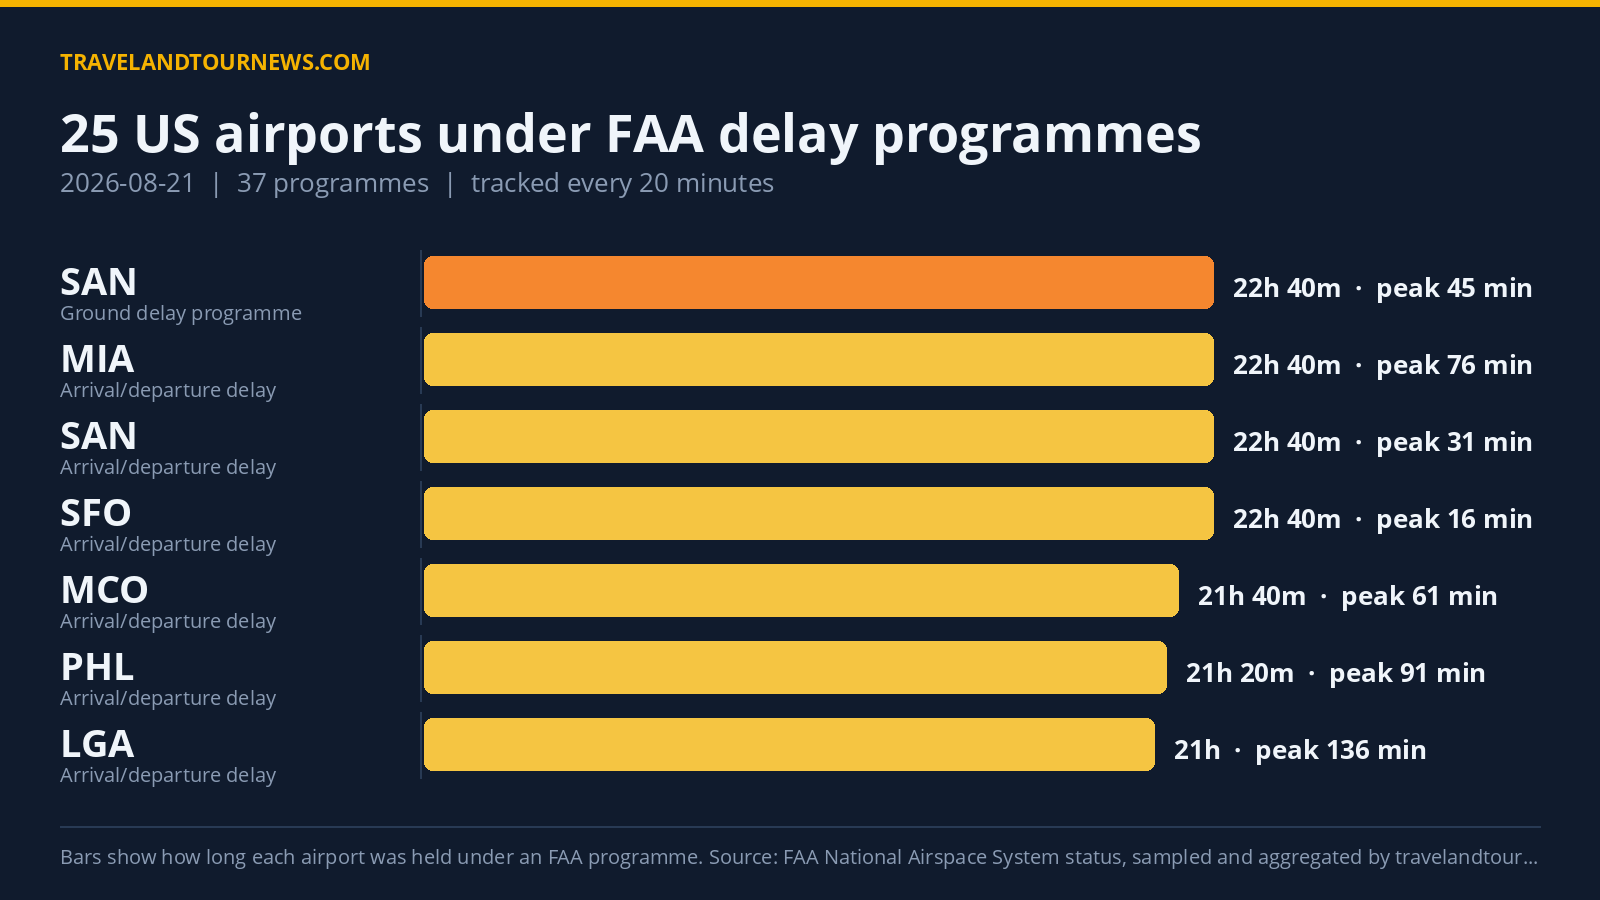
San Diego International (SAN) had the longest ground delay program, running nearly 23 hours from 00:00 to 22:40 UTC, caused by airport volume, producing peak average delays of 45 minutes and peaks up to 399 minutes. San Francisco International (SFO) had a ground delay program lasting 9 hours and 40 minutes driven by low ceilings with average peak delays of 51 minutes.
Newark Liberty International (EWR) had multiple programs: a 20-minute ground stop due to an aircraft emergency
early morning; a ground delay program lasting 3 hours and 20 minutes for thunderstorms with peak average delays of 231 minutes; and general delay info over 4 hours and 40 minutes related to TM Initiatives:SWAP:WX (traffic management).
| Airport | FAA programme | Cause | Peak average delay | In force (UTC) |
|---|---|---|---|---|
| Charlotte Douglas International (CLT) | Ground Stop Programs | thunderstorms | – | 12:40 to 22:40 (10 hours) |
| Chicago O’Hare International (ORD) | Ground Stop Programs | thunderstorms | – | 17:20 to 22:40 (5 hours 20 minutes) |
| John F. Kennedy International (JFK) | Ground Stop Programs | thunderstorms | – | 00:00 to 03:40 (3 hours 40 minutes) |
| ASE | Ground Stop Programs | security | – | 15:40 to 16:40 (1 hour) |
| TEB | Ground Stop Programs | thunderstorms | – | 00:00 to 00:00 (20 minutes) |
| LaGuardia (LGA) | Ground Stop Programs | thunderstorms | – | 00:00 to 00:20 (20 minutes) |
| Newark Liberty International (EWR) | Ground Stop Programs | aircraft emergency | – | 03:20 to 03:20 (20 minutes) |
| ILM | Ground Stop Programs | tornado or hurricane | – | 21:00 to 21:20 (20 minutes) |
| Denver International (DEN) | Ground Stop Programs | thunderstorms | – | 22:40 to 22:40 (20 minutes) |
| Orlando International (MCO) | Ground Stop Programs | thunderstorms | – | 22:40 to 22:40 (20 minutes) |
| Newark Liberty International (EWR) | Ground Delay Programs | thunderstorms | 231 min | 00:00 to 03:20 (3 hours 20 minutes) |
| Philadelphia International (PHL) | Ground Delay Programs | thunderstorms | 191 min | 00:00 to 02:00 (2 hours) |
| John F. Kennedy International (JFK) | Ground Delay Programs | thunderstorms | 101 min | 00:00 to 00:40 (40 minutes) |
| LaGuardia (LGA) | Ground Delay Programs | thunderstorms | 101 min | 00:00 to 00:00 (20 minutes) |
Thunderstorms Caused Most Delay Programs Followed by Weather and Volume
Thunderstorms were the predominant cause, cited in 58 programmes across the country and causing the ground stop programs at major hubs such as CLT, ORD, JFK, and others. TM Initiatives:SWAP:WX, a traffic management strategy related to weather, was the top reason overall, cited 74 times, mostly linked to general arrival and departure delays at airports like Newark, JFK, LaGuardia (LGA), and Teterboro (TEB).
Low ceilings created significant ground delays at Boston Logan (BOS) and San Francisco International (SFO), while airport volume generated the longest continuous delay program at San Diego International. Runway construction contributed to 23 delay programmes but was not responsible for the longest or peak delays.
Delay Programmes Increased From Previous Day, Highest in Tracking Week
Compared with August 20, 2026, when 16 airports were affected by 33 delay programmes, August 21 showed an increase of 9 more programmes impacting the same number of additional airports, indicating a significant rise in disruption.
The number of airports affected today and the total programmes reported represent the highest counts in the seven-day tracking
window, making August 21 the worst day in recent week-long monitoring.
All figures come from FAA delay data aggregated by travelandtournews.com.
Methodology. travelandtournews.com samples the FAA’s National Airspace System status feed every 20 minutes throughout the US operating day and aggregates the result. This report is built from 69 samples taken between 00:00 and 22:40 UTC on 2026-08-21. Durations are the observed window between the first and last sample in which a programme was in force, so a programme’s true length may be slightly longer than shown. Ground stops, ground delay programmes, airport closures and general delays are all published
by the FAA in real time; the daily aggregation is ours.