
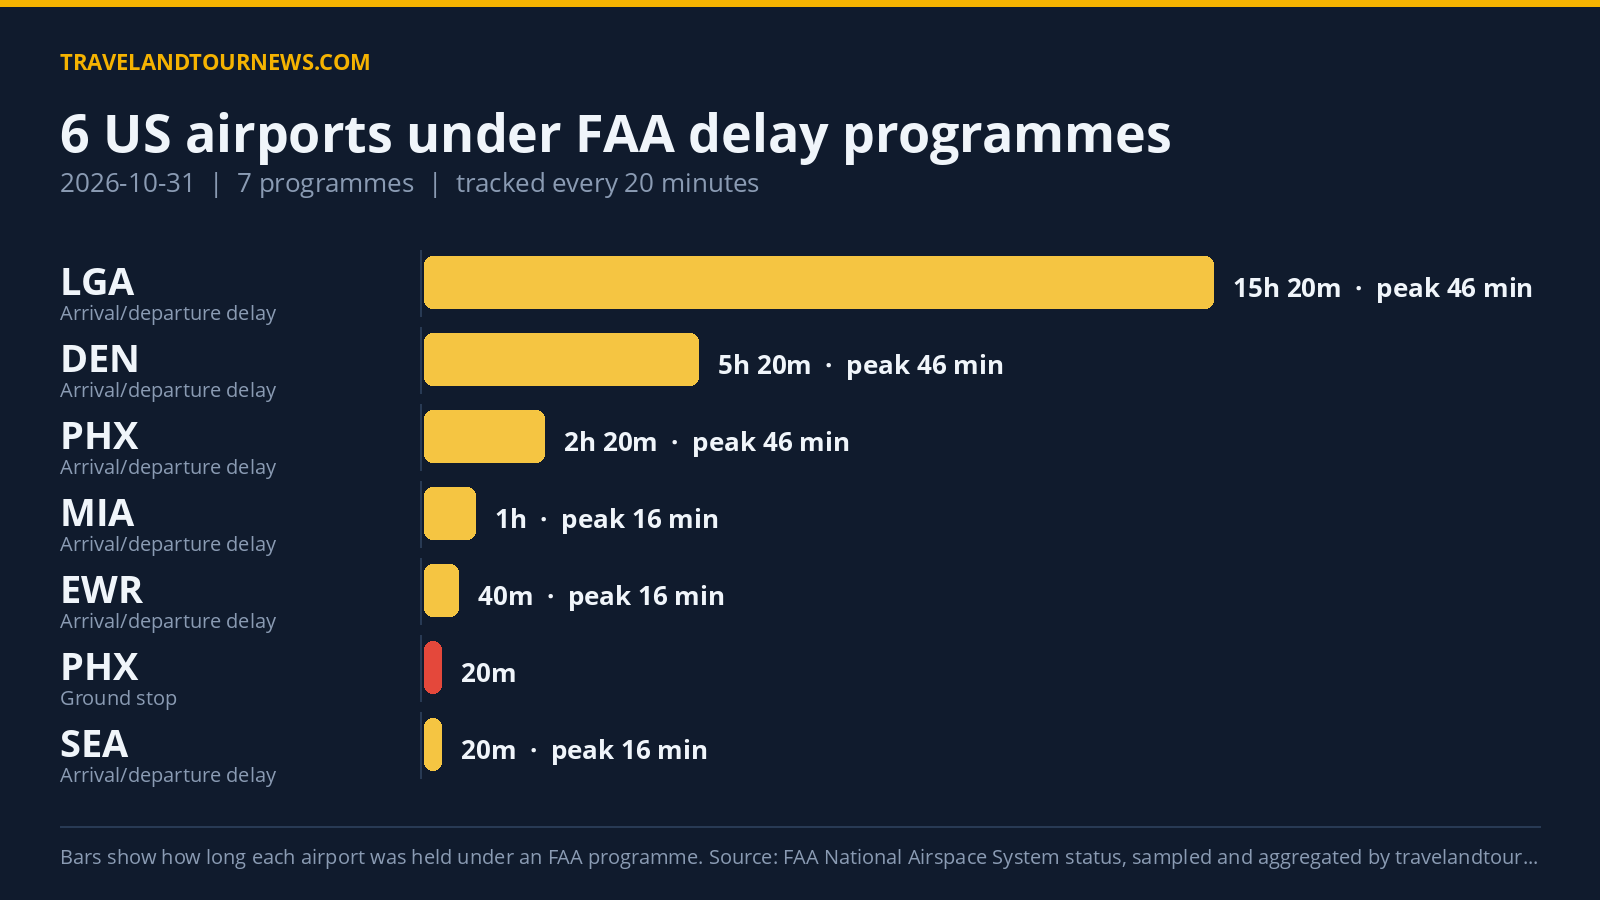

On October 31, 2026, the FAA held six United States airports under a total of seven delay programmes, according to FAA data tracked by travelandtournews.com. The worst-hit airport was Phoenix Sky Harbor International (PHX), where a thunderstorm-related ground stop was in effect for 20 minutes early in the day.
Delay Programmes at Six Major US Airports
The delay programmes involved one ground stop and six general arrival/departure delay programmes. A ground stop holds departures bound for an airport on the ground at their origin, preventing takeoff, while a general arrival/departure delay programme meters arrivals by assigning later departure times.
Phoenix Sky Harbor had the single ground stop programme from 01:40 to 02:00 UTC due to thunderstorms. This programme was observed in two samples over 20 minutes, though peak average and maximum delays were reported as zero during that short interval.
LaGuardia (LGA) operated a general arrival/departure delay programme for 15 hours and 20 minutes from midnight
through 15:20 UTC. This programme cited staffing shortages and runway maintenance as causes. It recorded peak average delays of 46 minutes and maximum delays of 60 minutes during this period, marking the highest peak delay across all airports.
Denver International (DEN) was subject to a general delay programme caused by low visibility related to weather from 12:00 to 17:20 UTC (5 hours 20 minutes). Peak average and maximum delays matched LaGuardia’s at 46 and 60 minutes, respectively.
Phoenix resumed activity with another general delay programme focusing on traffic management initiatives linked to weather, lasting 2 hours 20 minutes from 16:20
to 18:40 UTC, reaching peak average and maximum delays of 46 and 60 minutes.
Miami International (MIA) experienced a general delay programme for one hour (17:00 to 18:00 UTC) attributed to multi-taxi volume issues, reaching peak average delays of 16 minutes and peak maximum delays of 30 minutes.
Newark Liberty International (EWR) carried a 40-minute delay programme from 14:00 to 14:40 UTC, arising from compacted demand volume, with peak average delays of 16 minutes and maximum delays of 30 minutes.
Seattle-Tacoma International (SEA) had a 20-minute programme at 17:00 UTC caused by runway construction delays, reporting peak average delays of
16 minutes and peak maximum delays of 30 minutes.
| Airport | FAA programme | Cause | Peak average delay | In force (UTC) |
|---|---|---|---|---|
| Phoenix Sky Harbor International (PHX) | Ground Stop Programs | THUNDERSTORMS | – | 01:40 to 02:00 (20 minutes) |
| LaGuardia (LGA) | General Arrival/Departure Delay Info | STAFF:Staffing; runway:13/31clsd_maintenance | 46 min | 00:00 to 15:20 (15 hours 20 minutes) |
| Denver International (DEN) | General Arrival/Departure Delay Info | ZDV / WX:Low Visibility | 46 min | 12:00 to 17:20 (5 hours 20 minutes) |
| Phoenix Sky Harbor International (PHX) | General Arrival/Departure Delay Info | TM Initiatives:MIT:WX | 46 min | 16:20 to 18:40 (2 hours 20 minutes) |
| Miami International (MIA) | General Arrival/Departure Delay Info | VOL:Multi-taxi | 16 min | 17:00 to 18:00 (1 hour) |
| Newark Liberty International (EWR) | General Arrival/Departure Delay Info | VOL:Compacted Demand | 16 min | 14:00 to 14:40 (40 minutes) |
| Seattle-Tacoma International (SEA) | General Arrival/Departure Delay Info | RWY:Construction | 16 min | 17:00 to 17:00 (20 minutes) |
Staffing and Weather Were Leading Causes on October 31
The FAA’s stated causes for October 31 programmes show staffing shortages as the most frequent driver, cited in 18 programme samples. Low visibility due to weather and traffic management initiatives related to weather each contributed eight samples, tying for the second most common cause.
Volume-related reasons appeared as well: four samples attributed delays to multi-taxi congestion, and three to compacted demand. Runway construction and maintenance were also noted causes at Seattle and LaGuardia.
Delay Programmes Declined from Yesterday and Are Below Weekly Average
Compared to October 30, 2026, when 12 airports were affected by 18 delay programmes, October 31 saw a
decrease to six airports and seven programmes—a decline of six programmes day over day. The number of affected airports also dropped by half.
October 31’s airport count was below the recent seven-day average of 10.3 airports affected per day. Today’s peak delays, including a 60-minute maximum average delay, did not mark the highest in the tracking window.
Methodology. travelandtournews.com samples the FAA’s National Airspace System status feed every 20 minutes throughout the US operating day and aggregates the result. This report is built from 63 samples taken between 00:00 and 22:00 UTC on 2026-10-31. Durations are the observed window between
the first and last sample in which a programme was in force, so a programme’s true length may be slightly longer than shown. Ground stops, ground delay programmes, airport closures and general delays are all published by the FAA in real time; the daily aggregation is ours.