
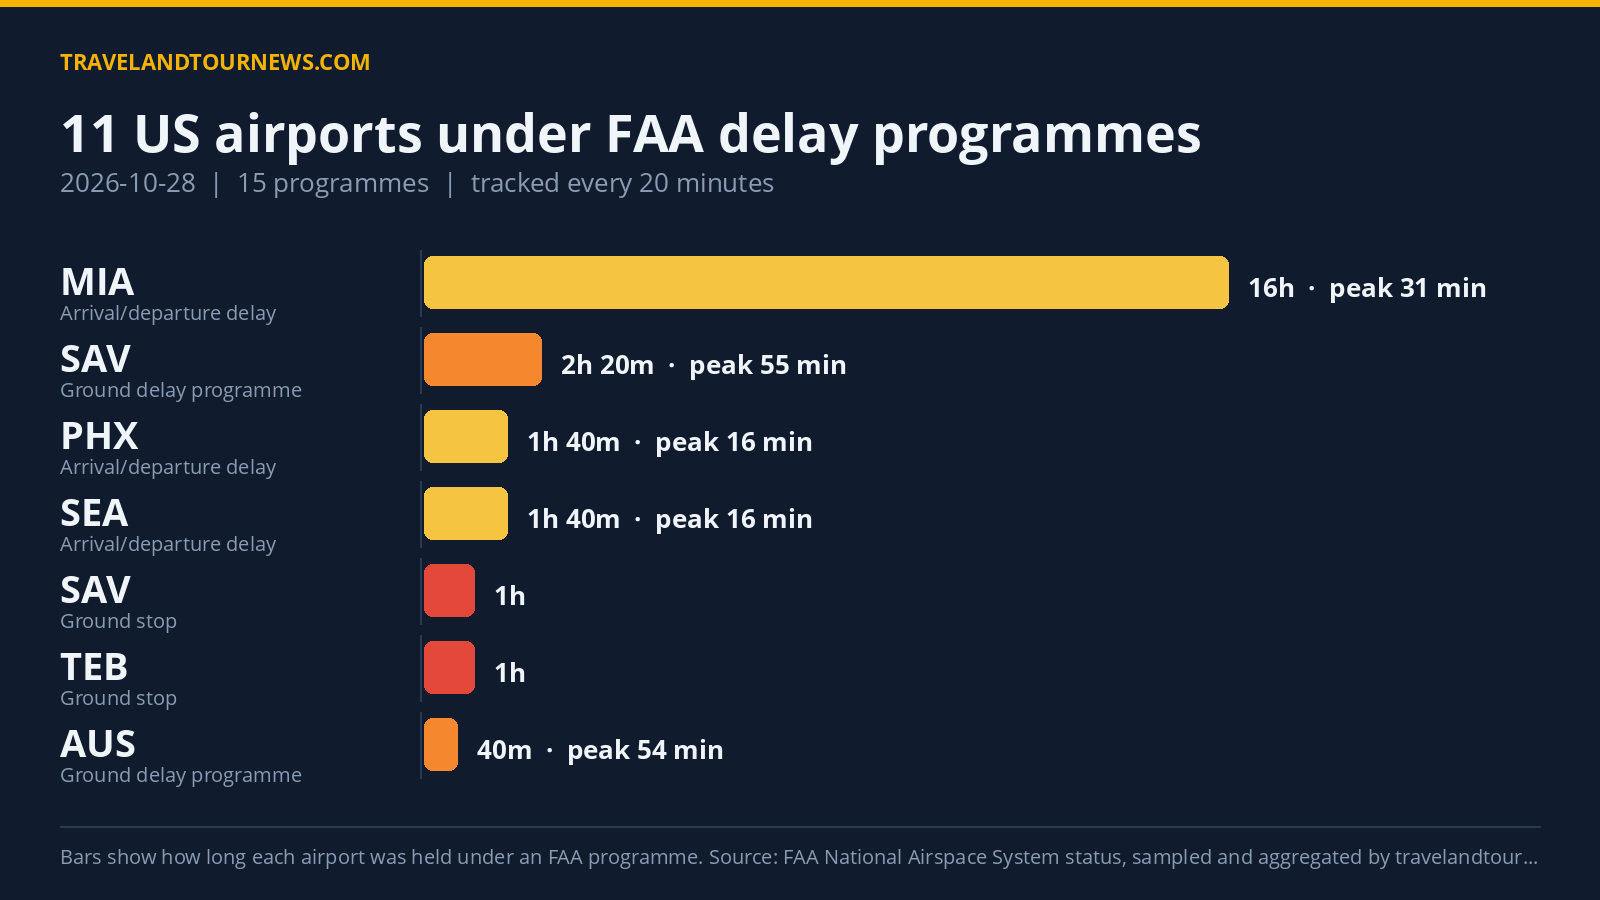

On October 28, 2026, the FAA held 11 United States airports under 15 delay programs. The worst-hit airport was Savannah (SAV), which experienced a ground stop due to an equipment outage, followed by a ground delay program causing peak average delays of 55 minutes and a maximum delay of 114 minutes. The highest peak delay recorded was 236 minutes at Teterboro (TEB).
FAA Delay Programs and Airport Impact Details
Among the 11 airports affected, four were under ground stop programs, which hold departures bound for the airport at their origin. These included Savannah (SAV), Teterboro (TEB), Austin (AUS), and Newark Liberty International (EWR). The Savannah ground stop lasted one hour from 15:00 to 16:00 UTC due to an equipment outage but recorded zero peak delays during the hold.
Ground delay programs, which meter arrivals by assigning later departure times, were active simultaneously or sequentially at Savannah, Teterboro, Austin, Newark, and two late programs at Teterboro and Newark starting after 22:20 UTC. Savannah’s ground delay program was observed for 2
hours and 20 minutes, peaking at a 55-minute average delay. Austin’s ground delay program with low ceilings was observed for 40 minutes, peaking at 54 minutes average delay and 135 minutes maximum delay.
Seven programs provided general arrival and departure delay info, present at Miami International (MIA) for 16 hours due to runway construction, Phoenix Sky Harbor (PHX) for 100 minutes owing to multiple taxiways usage, Seattle-Tacoma (SEA) with runway construction delays for 1 hour 40 minutes, and other airports including San Diego (SAN), Ronald Reagan Washington National (DCA), Philadelphia (PHL), and Fort Lauderdale-Hollywood (FLL) with short delay programs ranging
from 20 to 40 minutes.
| Airport | FAA programme | Cause | Peak average delay | In force (UTC) |
|---|---|---|---|---|
| SAV | Ground Stop Programs | equipment outage | – | 15:00 to 16:00 (1 hour) |
| TEB | Ground Stop Programs | airport volume; STAFFING | – | 21:00 to 22:00 (1 hour) |
| AUS | Ground Stop Programs | low ceilings | – | 15:40 to 16:00 (20 minutes) |
| Newark Liberty International (EWR) | Ground Stop Programs | STAFFING | – | 21:40 to 22:00 (20 minutes) |
| TEB | Ground Delay Programs | other | 128 min | 22:20 to 22:40 (20 minutes) |
| Newark Liberty International (EWR) | Ground Delay Programs | other | 65 min | 22:20 to 22:40 (20 minutes) |
| SAV | Ground Delay Programs | equipment outage | 55 min | 16:20 to 18:40 (2 hours 20 minutes) |
| AUS | Ground Delay Programs | low ceilings | 54 min | 16:20 to 17:00 (40 minutes) |
| Miami International (MIA) | General Arrival/Departure Delay Info | RWY:Construction | 31 min | 00:00 to 16:00 (16 hours) |
| Phoenix Sky Harbor International (PHX) | General Arrival/Departure Delay Info | VOL:Multi-taxi | 16 min | 16:40 to 18:20 (1 hour 40 minutes) |
| Seattle-Tacoma International (SEA) | General Arrival/Departure Delay Info | RWY:Construction | 16 min | 18:00 to 19:40 (1 hour 40 minutes) |
| San Diego International (SAN) | General Arrival/Departure Delay Info | VOL:Compacted Demand | 16 min | 18:40 to 19:20 (40 minutes) |
| Ronald Reagan Washington National (DCA) | General Arrival/Departure Delay Info | TM Initiatives:MIT:EQ | 16 min | 15:00 to 15:20 (20 minutes) |
| Philadelphia International (PHL) | General Arrival/Departure Delay Info | RWY:Maintenance | 16 min | 15:00 to 15:20 (20 minutes) |
Program Causes and Leading Delay Factors
The majority of delay programs originated from runway construction, accounting for 24 samples, making it the top reason across affected airports such as Miami and Seattle-Tacoma. Equipment outages were the second-leading cause with 11 samples, primarily impacting Savannah.
Low ceilings caused delays in Austin with five samples logged. Other notable causes included multi-taxi volume congestion (4 samples) at Phoenix, and staffing shortages (4 samples) impacting Teterboro, Newark, and others. Demand compaction contributed to delays at San Diego and Fort Lauderdale-Hollywood, while special traffic management initiatives influenced short delays at Washington National.
Comparing October 28 with Previous Days
The total number of
affected airports on October 28 was 11, which is three more than the eight airports affected on the previous day. Similarly, the number of delay programs rose from 10 yesterday to 15 today. These figures are consistent with the recent seven-day average of about 11 airports and 15 programs, indicating October 28 had average delay impacts by recent standards. The day’s disruptions were not the highest within the tracking window.
Methodology. travelandtournews.com samples the FAA’s National Airspace System status feed every 20 minutes throughout the US operating day and aggregates the result. This report is built from 65 samples taken
between 00:00 and 22:40 UTC on 2026-10-28. Durations are the observed window between the first and last sample in which a programme was in force, so a programme’s true length may be slightly longer than shown. Ground stops, ground delay programmes, airport closures and general delays are all published by the FAA in real time; the daily aggregation is ours.