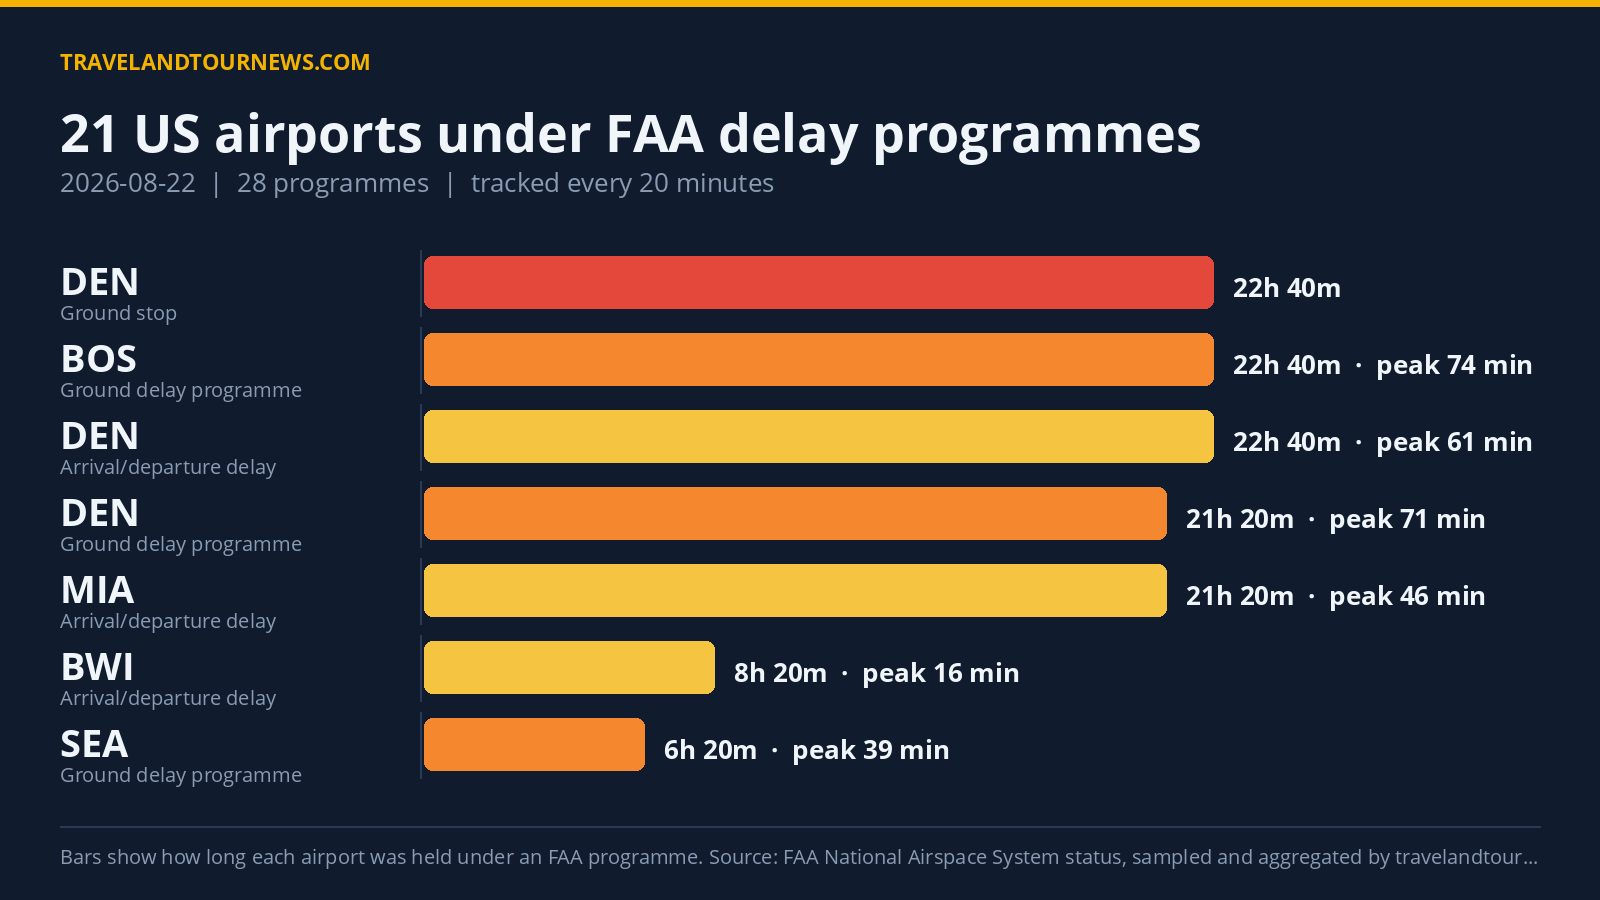

On August 22, 2026, the FAA held 21 airports across the United States under 28 delay programs. Denver International Airport (DEN) was the worst affected, experiencing peak delays reaching 290 minutes.
Airport Delay Programs Across the United States
The Federal Aviation Administration applied six Ground Stop Programs, ten Ground Delay Programs, and twelve General Arrival/Departure Delay updates during the day. Ground Stops prevent departure from origin airports for flights headed to the delay site, while Ground Delay Programs meter arrivals by assigning later departure times.
Denver International Airport operated under a Ground Stop Program for 22 hours and 40 minutes starting at midnight UTC due to thunderstorms. Although its peak average delay registered as zero in this category, it recorded peak average delays of 71 minutes and maximum delays of 228 minutes under a concurrent Ground Delay Program
lasting over 21 hours. Denver’s combined delay impact was the longest running and among the most severe nationwide.
Other airports under Ground Stop Programs caused by thunderstorms included Detroit Metropolitan Wayne County (DTW) for 2 hours 40 minutes, Raleigh-Durham International (RDU) and Toronto Pearson (YYZ) for one hour each, Louis Armstrong New Orleans International (MSY), and Vancouver International (YVR) briefly for 20 minutes each.
John F. Kennedy International (JFK) faced the longest Ground Delay Program caused by “other” factors lasting 5 hours and 20 minutes, peaking with a 196-minute average delay and maximum delay of 290 minutes—the highest peak max
delay recorded among all programs. Chicago O’Hare International (ORD) encountered 3 hours of thunderstorm-driven Ground Delay Programs with average delays up to 77 minutes.
Boston Logan International (BOS) and Seattle-Tacoma International (SEA) experienced Ground Delay Programs for low ceilings lasting 22 hours 40 minutes and 6 hours 20 minutes respectively. Peak average delays were 74 minutes at BOS and 39 minutes at SEA.
San Diego International (SAN) recorded 3 hours 20 minutes of Ground Delay Programs due to airport volume. Austin (AUS) had 3 hours 40 minutes of Ground Delay Programs caused by runway maintenance. Dayton (DAY) experienced 20 minutes
of delay from an equipment outage.
| Airport | FAA programme | Cause | Peak average delay | In force (UTC) |
|---|---|---|---|---|
| Denver International (DEN) | Ground Stop Programs | thunderstorms | – | 00:00 to 22:40 (22 hours 40 minutes) |
| Detroit Metropolitan Wayne County (DTW) | Ground Stop Programs | thunderstorms | – | 15:20 to 18:00 (2 hours 40 minutes) |
| Raleigh-Durham International (RDU) | Ground Stop Programs | thunderstorms | – | 00:00 to 01:00 (1 hour) |
| YYZ | Ground Stop Programs | thunderstorms | – | 20:40 to 21:40 (1 hour) |
| Louis Armstrong New Orleans International (MSY) | Ground Stop Programs | thunderstorms | – | 00:20 to 00:20 (20 minutes) |
| YVR | Ground Stop Programs | thunderstorms | – | 18:00 to 18:00 (20 minutes) |
| John F. Kennedy International (JFK) | Ground Delay Programs | other | 196 min | 17:20 to 22:40 (5 hours 20 minutes) |
| YYZ | Ground Delay Programs | thunderstorms | 103 min | 22:00 to 22:40 (40 minutes) |
| Chicago O’Hare International (ORD) | Ground Delay Programs | thunderstorms | 77 min | 00:00 to 03:00 (3 hours) |
| Boston Logan International (BOS) | Ground Delay Programs | low ceilings | 74 min | 00:00 to 22:40 (22 hours 40 minutes) |
| Denver International (DEN) | Ground Delay Programs | thunderstorms | 71 min | 01:20 to 22:40 (21 hours 20 minutes) |
| San Francisco International (SFO) | Ground Delay Programs | low ceilings | 51 min | 00:00 to 04:00 (4 hours) |
| San Diego International (SAN) | Ground Delay Programs | airport volume | 45 min | 00:00 to 03:20 (3 hours 20 minutes) |
| Seattle-Tacoma International (SEA) | Ground Delay Programs | low ceilings | 39 min | 13:00 to 19:20 (6 hours 20 minutes) |
Thunderstorms and Low Ceilings Led Most Delay Programs
Thunderstorms were the top cause behind 56 delay program samples, followed closely by low ceilings at 55 samples. FAA-identified reasons included thunderstorm-related programs labeled as “thunderstorms” or weather-related Traffic Management initiatives referring to thunderstorms or wind.
Other assigned reasons included “TM Initiatives:MIT:WX” with 27 samples representing traffic management weather initiatives, “other” causes with 17 samples, and runway maintenance at 12 samples. Ground Stops were exclusively linked to thunderstorms, confirming severe weather as the primary disruptor triggering complete airport departure halts on the day.
Comparison With Previous Day and Weekly Average
Compared with the previous day, August 21, which affected 25 airports
with 37 programs, delay activity decreased by four programs and four airports today. However, the number of airports affected today (21) was above the 7-day average of 16.7.
August 22 did not set any highest-ever records in the seven-day tracking window for either the number of airports affected or total delay programs.
Methodology. travelandtournews.com samples the FAA’s National Airspace System status feed every 20 minutes throughout the US operating day and aggregates the result. This report is built from 69 samples taken between 00:00 and 22:40 UTC on 2026-08-22. Durations are the observed window between the first and last sample
in which a programme was in force, so a programme’s true length may be slightly longer than shown. Ground stops, ground delay programmes, airport closures and general delays are all published by the FAA in real time; the daily aggregation is ours.