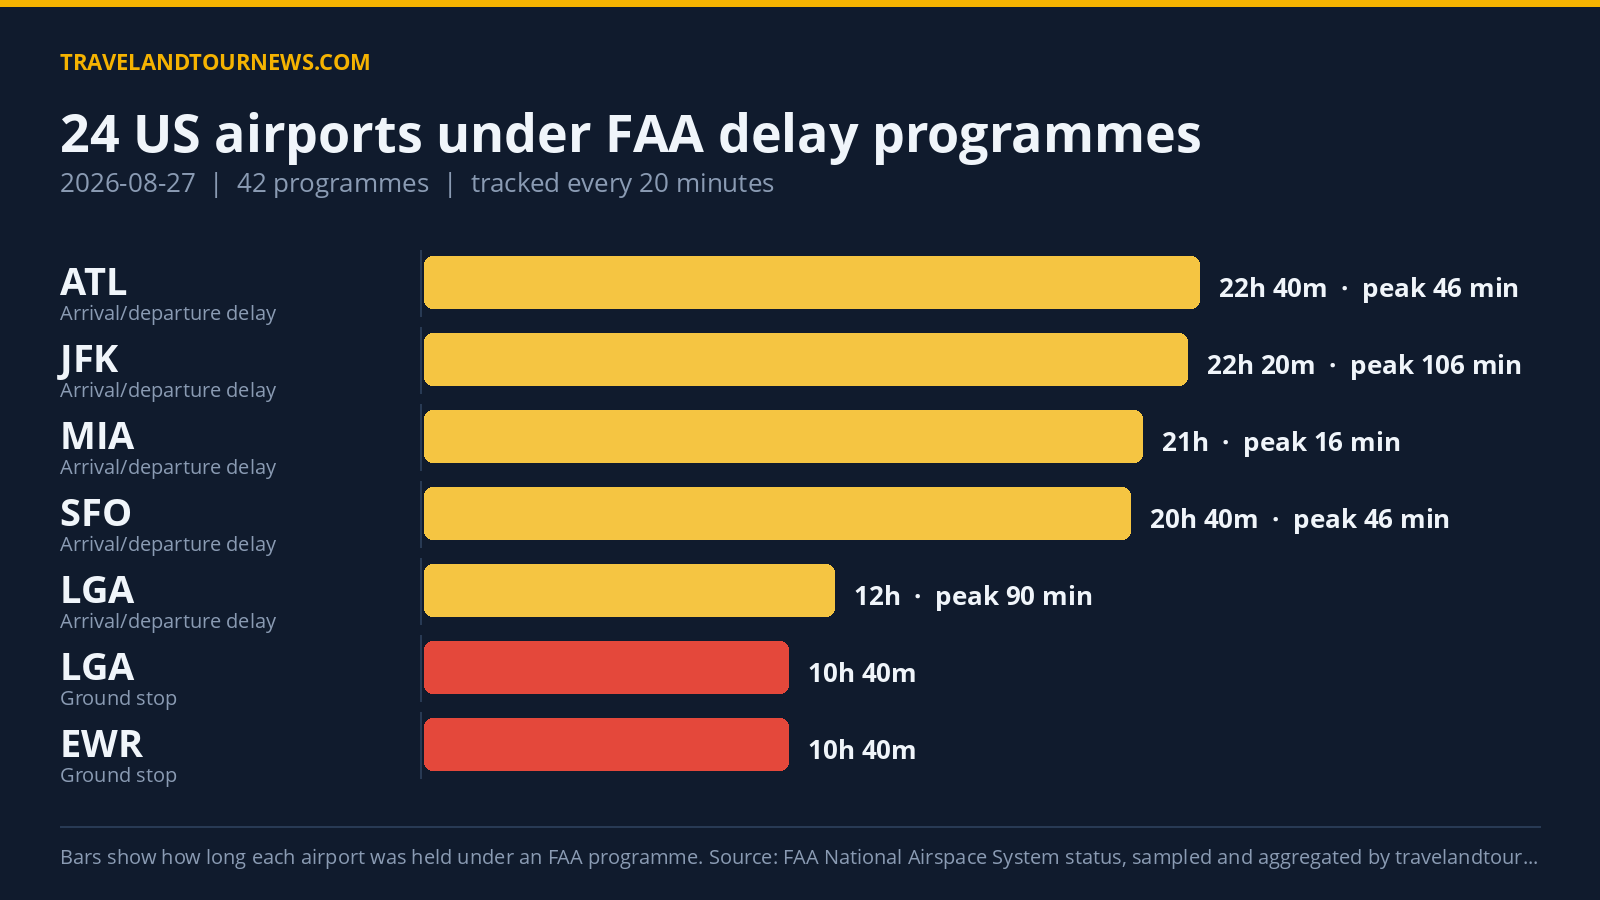

On August 27, 2026, the FAA implemented delay programs affecting 24 airports across the United States, with a total of 42 distinct programs recorded. LaGuardia Airport (LGA) was the worst-hit facility, enduring extensive ground stop and ground delay programs due to thunderstorms. The peak average delay reached 243 minutes, with a maximum delay of 647 minutes recorded during the day.
Delay Programs Active Across 24 Airports, Over 10 Hours at LaGuardia
Among the 42 programs, 13 were Ground Stop Programs, 8 were Ground Delay Programs, and 21 involved general arrival and departure delay information. A ground stop program restricts departures bound for the affected airport, holding aircraft on the ground at their origin, while a ground delay program assigns later departure times to meter arrivals.
LaGuardia (LGA) experienced the longest disruption, with a ground stop program observed from 12:00 to 22:40 UTC, spanning 10 hours and 40 minutes. This was coupled with a ground delay program lasting 10 hours. Neither had recorded average or maximum delays for the ground stops themselves,
yet the ground delay program registered a peak average delay of 141 minutes and a peak maximum delay of 449 minutes. Similarly, Newark Liberty International (EWR) faced 18 samples of ground stops and 25 of ground delays spanning 10 hours and 40 minutes and 8 hours respectively, both attributed to thunderstorms, with delays peaking at an average of 243 minutes and max of 647 for ground delays.
| Airport | FAA programme | Cause | Peak average delay | In force (UTC) |
|---|---|---|---|---|
| LaGuardia (LGA) | Ground Stop Programs | thunderstorms | – | 12:00 to 22:40 (10 hours 40 minutes) |
| Newark Liberty International (EWR) | Ground Stop Programs | thunderstorms | – | 12:00 to 22:40 (10 hours 40 minutes) |
| TEB | Ground Stop Programs | thunderstorms | – | 13:00 to 22:40 (9 hours 40 minutes) |
| Philadelphia International (PHL) | Ground Stop Programs | thunderstorms | – | 15:40 to 22:40 (7 hours) |
| John F. Kennedy International (JFK) | Ground Stop Programs | thunderstorms; THUNDERSTORMS | – | 17:20 to 21:40 (4 hours 20 minutes) |
| Denver International (DEN) | Ground Stop Programs | thunderstorms; airport volume | – | 00:00 to 02:40 (2 hours 40 minutes) |
| YUL | Ground Stop Programs | OCL:; other | – | 17:40 to 20:00 (2 hours 20 minutes) |
| Washington Dulles International (IAD) | Ground Stop Programs | thunderstorms | – | 19:40 to 21:20 (1 hour 40 minutes) |
| Orlando International (MCO) | Ground Stop Programs | thunderstorms | – | 20:00 to 21:00 (1 hour) |
| Dallas/Fort Worth International (DFW) | Ground Stop Programs | thunderstorms | – | 00:00 to 00:20 (20 minutes) |
| Seattle-Tacoma International (SEA) | Ground Stop Programs | runway maintenance | – | 18:20 to 18:40 (20 minutes) |
| Baltimore/Washington International (BWI) | Ground Stop Programs | THUNDERSTORMS | – | 21:20 to 21:20 (20 minutes) |
| Ronald Reagan Washington National (DCA) | Ground Stop Programs | thunderstorms | – | 22:20 to 22:40 (20 minutes) |
| Newark Liberty International (EWR) | Ground Delay Programs | thunderstorms | 243 min | 14:40 to 22:40 (8 hours) |
Other major airports with extended ground stops include Teterboro (TEB) for 9 hours and 40 minutes, Philadelphia International (PHL) for 7 hours, and John F. Kennedy International (JFK) for 4 hours and 20 minutes. Each of these experienced ground stop and ground delay programs mainly caused by thunderstorms. Denver International (DEN) had a ground stop lasting 2 hours and 40 minutes, partly due to airport volume.
General arrival and departure delay info programs, separate from ground stops and delays, were also widespread. For example, TEB and EWR both had extended general delay notices driven by the FAA’s traffic management
initiatives linked to weather.
Thunderstorms Drove Most Delay Programs on August 27
The dominant cause for delay programs was thunderstorms, cited 228 times across all monitoring intervals. Variants of this termed as “thunderstorms” and “WX:Thunderstorms” together accounted for the majority of disruptions. FAA’s traffic management initiatives responding to weather-related conditions contributed 169 references, including “TM Initiatives:SWAP:WX” and “TM Initiatives:MIT:WX.”
Other weather-related factors included low ceilings, responsible for 19 records, and airport volume for select airports. For example, San Diego International (SAN) experienced delays related to low ceilings combined with airport volume. Some airports, such as YUL, had delay causes listed as “OCL:” and other unspecified reasons by the
FAA.
Delay Impact Increased Sharply Compared to Yesterday and Weekly Average
Compared to August 26, 2026, the number of affected airports doubled from 12 to 24, and delay programs rose from 15 to 42. This represents an increase of 12 airports affected versus yesterday. The average number of airports affected over the past seven days is 18.1, placing today above the weekly average, although not the highest in the tracking window. The duration and intensity of the delay programs today considerably surpassed the previous day’s levels.
Methodology. travelandtournews.com samples the FAA’s National Airspace System status feed every 20 minutes throughout the US operating day and aggregates the result. This report
is built from 63 samples taken between 00:00 and 22:40 UTC on 2026-08-27. Durations are the observed window between the first and last sample in which a programme was in force, so a programme’s true length may be slightly longer than shown. Ground stops, ground delay programmes, airport closures and general delays are all published by the FAA in real time; the daily aggregation is ours.