
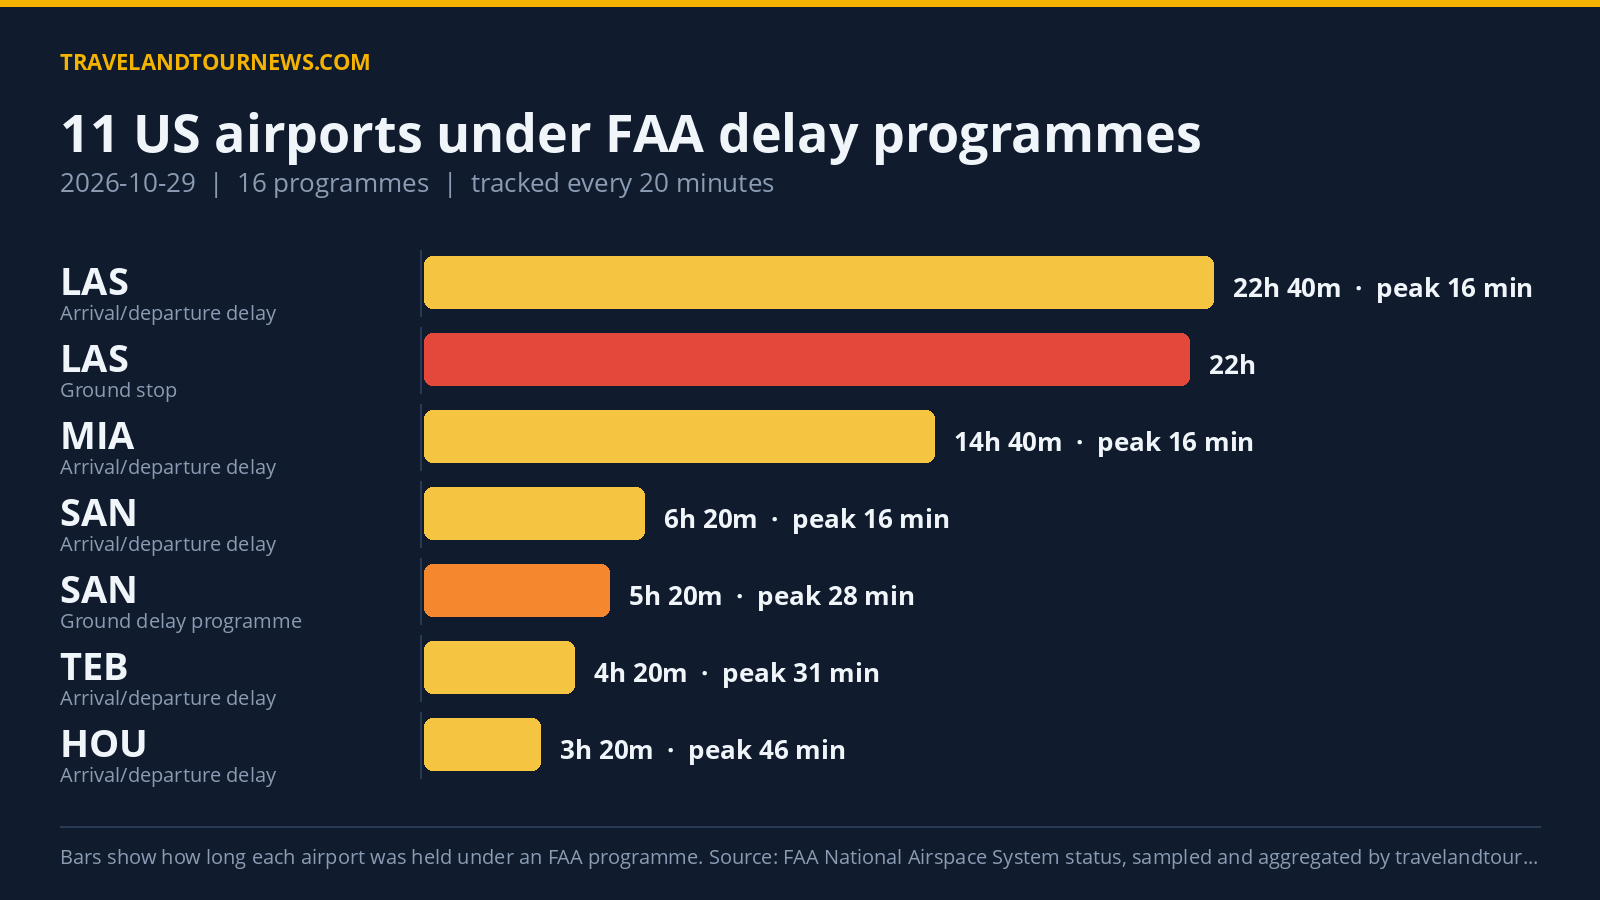

On October 29, 2026, the FAA held 11 airports across the United States under a total of 16 delay programs. Harry Reid International Airport (LAS) was the worst-affected, with delays linked to staffing and wind issues stretching over 22 hours.
Delay Program Types and Durations by Airport
The FAA implemented four ground stop programs and four ground delay programs on this day. Ground stops hold departures bound for an airport on the ground at their origin, while ground delay programs meter arrivals by assigning later departure times.
Harry Reid International (LAS) was subject to two ground stop programs from 00:40 UTC until 22:40 UTC, lasting roughly 22 hours, cited for staffing and wind. Additionally, LAS had a ground delay program between 01:00 and 03:00 UTC, spanning 2 hours, and general arrival/departure delay information observed over 22 hours 40 minutes.
Newark Liberty International (EWR) experienced a ground delay
program from 00:00 to 02:00 UTC lasting 2 hours due to unspecified other causes. San Diego International (SAN) had a lengthy ground delay program from 14:40 to 20:00 UTC, which lasted 5 hours 20 minutes, driven by airport volume.
Other airports under ground stop programs included Ronald Reagan Washington National (DCA) for 40 minutes late in the day, Charlotte Douglas International (CLT) for 20 minutes, each citing separate special reasons such as VIP or generic other causes. Toronto Pearson (YYZ) held a ground stop for 1 hour 20 minutes driven by low visibility.
| Airport | FAA programme | Cause | Peak average delay | In force (UTC) |
|---|---|---|---|---|
| Harry Reid International (LAS) | Ground Stop Programs | STAFFING; wind | – | 00:40 to 22:40 (22 hours) |
| YYZ | Ground Stop Programs | low visibility | – | 11:20 to 12:40 (1 hour 20 minutes) |
| Ronald Reagan Washington National (DCA) | Ground Stop Programs | other | – | 21:00 to 21:40 (40 minutes) |
| Charlotte Douglas International (CLT) | Ground Stop Programs | VIP | – | 19:40 to 20:00 (20 minutes) |
| TEB | Ground Delay Programs | other | 128 min | 00:00 to 00:00 (20 minutes) |
| Newark Liberty International (EWR) | Ground Delay Programs | other | 65 min | 00:00 to 02:00 (2 hours) |
| Harry Reid International (LAS) | Ground Delay Programs | other | 42 min | 01:00 to 03:00 (2 hours) |
| San Diego International (SAN) | Ground Delay Programs | airport volume | 28 min | 14:40 to 20:00 (5 hours 20 minutes) |
| William P. Hobby (HOU) | General Arrival/Departure Delay Info | OTHER: | 46 min | 19:20 to 22:40 (3 hours 20 minutes) |
| TEB | General Arrival/Departure Delay Info | VOL:Volume; VOL:INDIVIDUAL RELEASES | 31 min | 14:40 to 19:00 (4 hours 20 minutes) |
| Harry Reid International (LAS) | General Arrival/Departure Delay Info | WX:Wind | 16 min | 00:00 to 22:40 (22 hours 40 minutes) |
| Miami International (MIA) | General Arrival/Departure Delay Info | RWY:Construction | 16 min | 01:00 to 15:40 (14 hours 40 minutes) |
| San Diego International (SAN) | General Arrival/Departure Delay Info | VOL:Compacted Demand; VOL:Volume | 16 min | 16:20 to 22:40 (6 hours 20 minutes) |
| Seattle-Tacoma International (SEA) | General Arrival/Departure Delay Info | RWY:Construction | 16 min | 18:00 to 20:00 (2 hours) |
Leading Causes of Delay Programs on October 29, 2026
The dataset identifies “other” as the most
frequent cause of delay programs, leading 18 instances. Airport volume and wind were prominent causes, contributing to 16 and 15 programs respectively. Construction on runways accounted for 11 programs, with volume-related causes (including compacted demand and multi-taxi) also cited 11 times.
Specifically, Harry Reid International’s extensive ground stop programs and arrival/departure delays were attributed to staffing shortages and wind. San Diego’s ground delays largely resulted from airport volume constraints, while Miami International faced runway construction delays for over 14 hours.
Comparison with Previous Data
The number of airports affected on October 29 matched the 11 affected on the previous day, with 16 total delay
programs compared to 15 the day before. This shows no change in the scope of disruptions. The seven-day average for airports affected stands at 11.4, placing this day slightly below average but not an extreme case.
Methodology. travelandtournews.com samples the FAA’s National Airspace System status feed every 20 minutes throughout the US operating day and aggregates the result. This report is built from 63 samples taken between 00:00 and 22:40 UTC on 2026-10-29. Durations are the observed window between the first and last sample in which a programme was in force, so a programme’s true length may be slightly longer
than shown. Ground stops, ground delay programmes, airport closures and general delays are all published by the FAA in real time; the daily aggregation is ours.