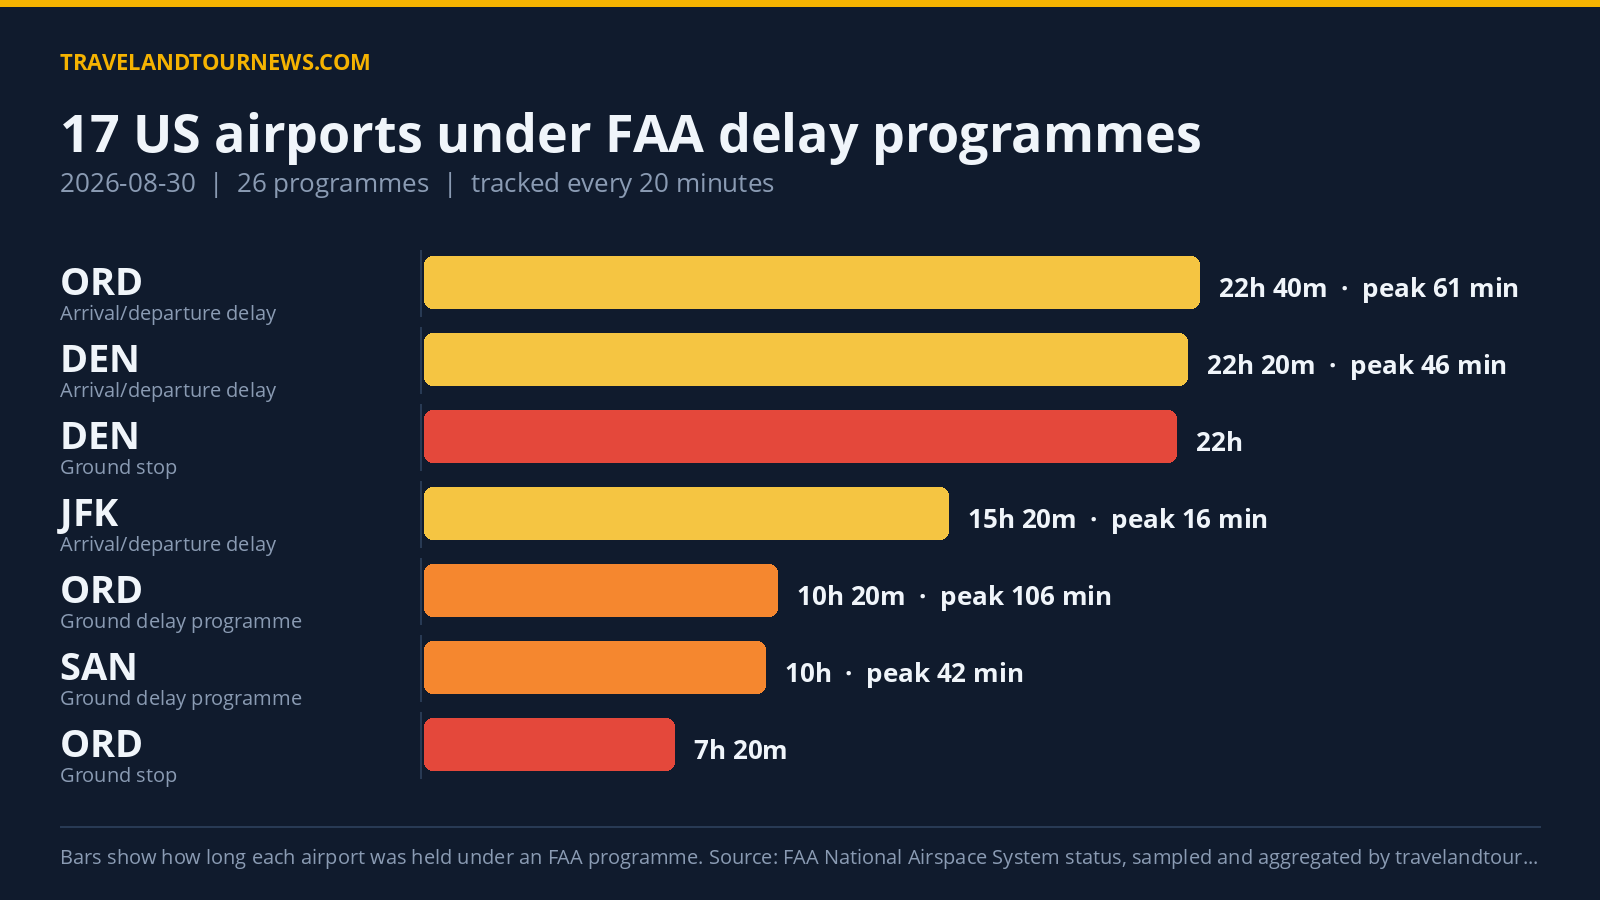

On August 30, 2026, the FAA implemented 26 delay programmes across 17 U.S. airports, with Denver International Airport (DEN) identified as the worst hit. The peak average delay reported reached 106 minutes, and the maximum delay observed was 304 minutes.
Delay Programmes Across 17 Airports Included Ground Stops and Delays
Among the 26 programmes, nine were Ground Stop Programmes, five were Ground Delay Programmes, and 12 provided general arrival or departure delay information. A ground stop holds departures bound for an airport on the ground at their origin; a ground delay programme meters arrivals by assigning later departure times.
Denver International Airport experienced a Ground Stop Programme for 22 hours due to thunderstorms, observed in five samples from midnight to 22:00 UTC. Despite the extended duration, it had no recorded peak delays in this category. Denver also had a Ground Delay Programme lasting 20 minutes later in the day with
an average delay of 47 minutes and a maximum of 188 minutes. Chicago O’Hare International (ORD) was under a Ground Stop Programme for 7 hours and 20 minutes due to thunderstorms and airspace volume and had a Ground Delay Programme spanning 10 hours and 20 minutes, peaking at 106 minutes average delay and 304 minutes maximum delay.
Other airports with Ground Stop Programmes included Tampa International (TPA) and YUL (Montreal) for about 1 hour each, both attributed to thunderstorms. ASE had a Ground Stop Programme lasting 40 minutes due to wind, while Raleigh-Durham International (RDU) and San Francisco International (SFO)
had shorter Ground Stops of 20 minutes each caused by low ceilings. Ronald Reagan Washington National (DCA) endured a 40-minute Ground Stop due to thunderstorms.
Ground Delay Programmes with extended durations were also active at San Diego International (SAN) for 10 hours due to airport volume and at YUL for 3 hours and 20 minutes involving thunderstorms and other reasons. DCA and DEN had short Ground Delay Programmes of 20 minutes each caused by low ceilings and thunderstorms respectively.
| Airport | FAA programme | Cause | Peak average delay | In force (UTC) |
|---|---|---|---|---|
| Denver International (DEN) | Ground Stop Programs | thunderstorms | – | 00:00 to 22:00 (22 hours) |
| Chicago O’Hare International (ORD) | Ground Stop Programs | thunderstorms; airspace volume | – | 11:20 to 18:40 (7 hours 20 minutes) |
| Tampa International (TPA) | Ground Stop Programs | thunderstorms | – | 21:00 to 22:00 (1 hour) |
| YUL | Ground Stop Programs | thunderstorms | – | 21:00 to 22:00 (1 hour) |
| ASE | Ground Stop Programs | wind | – | 19:20 to 20:00 (40 minutes) |
| Ronald Reagan Washington National (DCA) | Ground Stop Programs | thunderstorms | – | 22:00 to 22:40 (40 minutes) |
| Raleigh-Durham International (RDU) | Ground Stop Programs | low ceilings | – | 11:40 to 12:00 (20 minutes) |
| San Francisco International (SFO) | Ground Stop Programs | low ceilings | – | 17:00 to 17:00 (20 minutes) |
| Washington Dulles International (IAD) | Ground Stop Programs | thunderstorms | – | 19:20 to 19:40 (20 minutes) |
| Chicago O’Hare International (ORD) | Ground Delay Programs | thunderstorms; THUNDERSTORMS | 106 min | 12:20 to 22:40 (10 hours 20 minutes) |
| YUL | Ground Delay Programs | other; thunderstorms | 101 min | 19:20 to 22:40 (3 hours 20 minutes) |
| Denver International (DEN) | Ground Delay Programs | THUNDERSTORMS; thunderstorms | 47 min | 22:20 to 22:40 (20 minutes) |
| San Diego International (SAN) | Ground Delay Programs | airport volume | 42 min | 12:40 to 22:40 (10 hours) |
| Ronald Reagan Washington National (DCA) | Ground Delay Programs | low ceilings | 27 min | 22:20 to 22:40 (20 minutes) |
Thunderstorms and Airport Volume Drove Most Programmes
Thunderstorms were the most frequently stated cause, driving 45 programmes, followed by airport volume at 31 programmes. Other significant causes included
multi-taxi congestion at 24 programmes and thunderstorms noted in another code form at 18 programmes. Wind-related disruptions accounted for 11 programmes.
The majority of Ground Stop Programmes were linked to thunderstorms either alone or combined with airspace volume, while Ground Delay Programmes often involved thunderstorms and airport volume. General delay information programmes cited weather conditions such as thunderstorms and wind, as well as traffic management initiatives and volume-related issues like compacted demand and multi-taxi delays.
Delay Trends Show Slight Increase From Yesterday, Below Weekly Average
Compared to the previous day, August 29, which had 15 airports affected and 21 programmes in place, today’s figures show a modest increase of two
more programmes. However, the number of airports affected today, 17, remains slightly below the seven-day average of 18.4. This indicates a stable but slightly elevated level of delay activity compared to the prior day and near average for the recent week.
Methodology. travelandtournews.com samples the FAA’s National Airspace System status feed every 20 minutes throughout the US operating day and aggregates the result. This report is built from 69 samples taken between 00:00 and 22:40 UTC on 2026-08-30. Durations are the observed window between the first and last sample in which a programme was in force, so a programme’s true
length may be slightly longer than shown. Ground stops, ground delay programmes, airport closures and general delays are all published by the FAA in real time; the daily aggregation is ours.