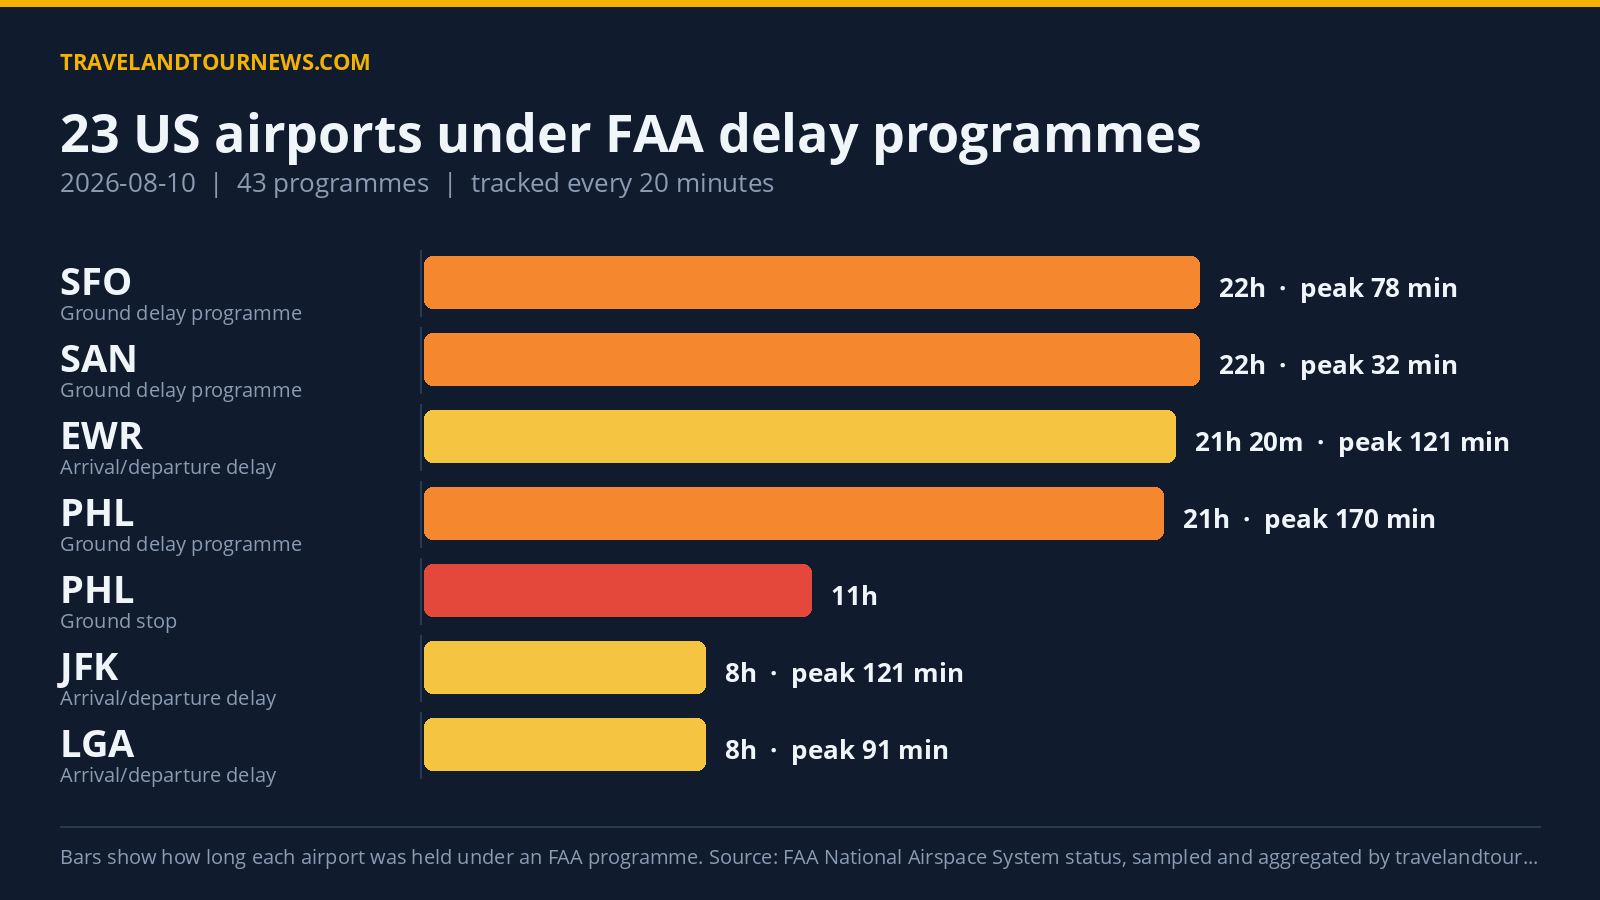

On August 10, 2026, the FAA enforced delay programmes affecting 23 airports across the United States, totaling 43 programmes. Philadelphia International Airport experienced the most severe disruption with a ground stop programme related to thunderstorms active for 11 hours.
Delay Programmes Across Major US Airports
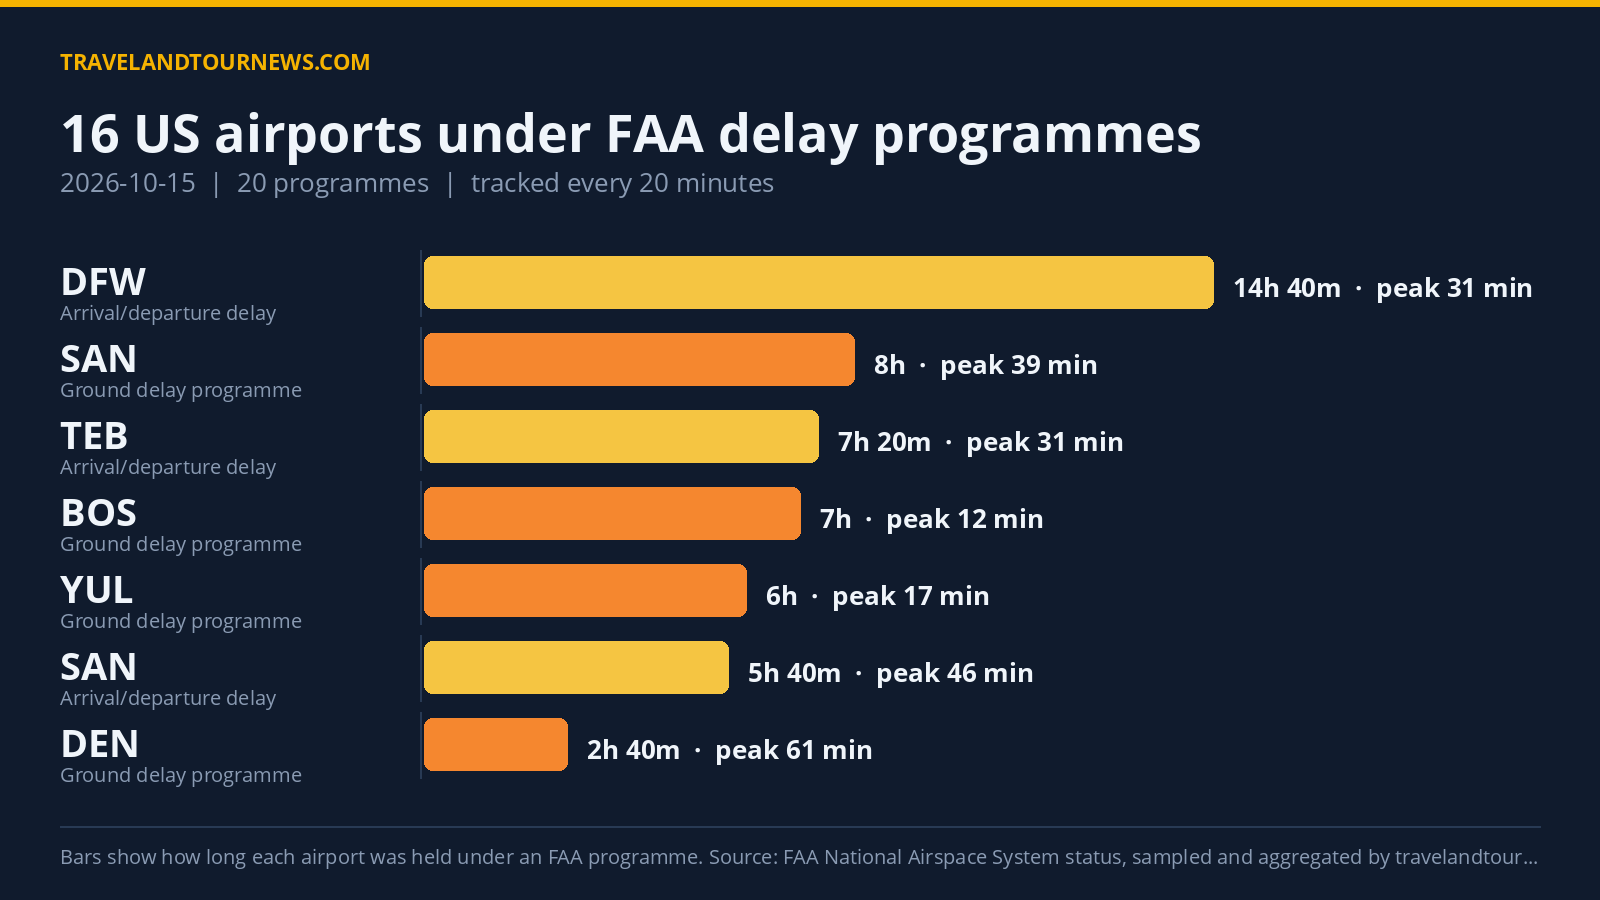
The 23 affected airports included major hubs such as Philadelphia (PHL), LaGuardia (LGA), Washington National (DCA), Newark Liberty (EWR), and San Francisco International (SFO). The FAA issued four types of delay programmes: 15 ground stop programmes, 11 ground delay programmes, one airport closure, and 16 general arrival or departure delay advisories.
A ground stop programme holds departures bound for an airport on the ground at their origin. A ground delay programme meters arrivals by assigning later departure times.
Philadelphia International Airport was under a ground stop programme related to thunderstorms from 11:20 UTC to 22:20 UTC, lasting 11 hours across
13 samples. Philadelphia also had a ground delay programme for 21 hours starting at 00:20 UTC, citing equipment outage and thunderstorms. Newark Liberty maintained a ground delay programme for 6 hours 20 minutes with peak average delays of 180 minutes and maximum delays up to 475 minutes, tied to thunderstorms and other reasons.
Other airports with significant ground stop programmes linked to thunderstorms included LaGuardia (3 hours), Washington Dulles (2 hours 40 minutes), Ronald Reagan Washington National (2 hours 40 minutes), and Newark Liberty (2 hours 40 minutes). San Francisco International bore a 22-hour ground delay programme for other reasons,
with peak average delays of 78 minutes.
| Airport | FAA programme | Cause | Peak average delay | In force (UTC) |
|---|---|---|---|---|
| Philadelphia International (PHL) | Ground Stop Programs | thunderstorms; THUNDERSTORMS | – | 11:20 to 22:20 (11 hours) |
| LaGuardia (LGA) | Ground Stop Programs | thunderstorms | – | 19:20 to 22:20 (3 hours) |
| Washington Dulles International (IAD) | Ground Stop Programs | thunderstorms | – | 19:20 to 22:00 (2 hours 40 minutes) |
| Ronald Reagan Washington National (DCA) | Ground Stop Programs | thunderstorms | – | 19:40 to 22:20 (2 hours 40 minutes) |
| Newark Liberty International (EWR) | Ground Stop Programs | thunderstorms | – | 19:40 to 22:20 (2 hours 40 minutes) |
| Baltimore/Washington International (BWI) | Ground Stop Programs | thunderstorms | – | 19:40 to 22:20 (2 hours 40 minutes) |
| John F. Kennedy International (JFK) | Ground Stop Programs | thunderstorms | – | 19:40 to 22:20 (2 hours 40 minutes) |
| YUL | Ground Stop Programs | other; thunderstorms | – | 20:00 to 22:00 (2 hours) |
| Chicago O’Hare International (ORD) | Ground Stop Programs | THUNDERSTORMS; thunderstorms | – | 03:00 to 04:40 (1 hour 40 minutes) |
| Boston Logan International (BOS) | Ground Stop Programs | thunderstorms | – | 18:20 to 20:00 (1 hour 40 minutes) |
| TEB | Ground Stop Programs | thunderstorms | – | 20:40 to 21:40 (1 hour) |
| Phoenix Sky Harbor International (PHX) | Ground Stop Programs | thunderstorms | – | 04:20 to 04:20 (20 minutes) |
| William P. Hobby (HOU) | Ground Stop Programs | THUNDERSTORMS; thunderstorms | – | 19:40 to 20:00 (20 minutes) |
| YYZ | Ground Stop Programs | thunderstorms | – | 20:20 to 20:20 (20 minutes) |
Thunderstorms Were the Leading Cause of Delay Programmes
Thunderstorms were the primary cause driving delays, cited in 188 measurements, the highest for any reason across the country. Related cause codes for thunderstorm activity, including “THUNDERSTORMS” and “WX:Thunderstorms,” accounted for an additional 24 samples. TM Initiatives attributed to weather conditions (TM Initiatives:SWAP:WX) were the second most frequent cause with 120 samples.
Other causes included unspecified reasons (“other”) with 52 samples and airport volume issues with 39 samples. The dataset explicitly linked equipment outages only to Philadelphia’s ground delay programme.
Program Volume Slightly Increased Compared to Yesterday
Compared to August 9, 2026, when 22 airports were affected by 35 programmes,
the volume of delay programmes on August 10 rose slightly with one more programme active. The affected airport count of 23 is above the recent 7-day average of 21.7 airports but is not the worst in the tracking window.
Methodology. travelandtournews.com samples the FAA’s National Airspace System status feed every 20 minutes throughout the US operating day and aggregates the result. This report is built from 64 samples taken between 00:20 and 22:20 UTC on 2026-08-10. Durations are the observed window between the first and last sample in which a programme was in force, so a programme’s true length may
be slightly longer than shown. Ground stops, ground delay programmes, airport closures and general delays are all published by the FAA in real time; the daily aggregation is ours.