
On October 15, 2026, the FAA held 16 United States airports under 20 active delay programmes. The worst-affected airport was Seattle-Tacoma International (SEA), which faced a one-hour ground stop due to low visibility, while overall peak delays across programmes reached 61 average minutes, with individual delays peaking at 114 minutes.
Airports and Delay Programme Details
Delay programmes were spread across 16 airports, consisting of four ground stop programmes, five ground delay programmes, and eleven general arrival/departure delay notifications. A ground stop holds departures destined for the affected airport on the ground before takeoff, while a ground delay programme meters arrivals by assigning later departure times to aircraft already en route.
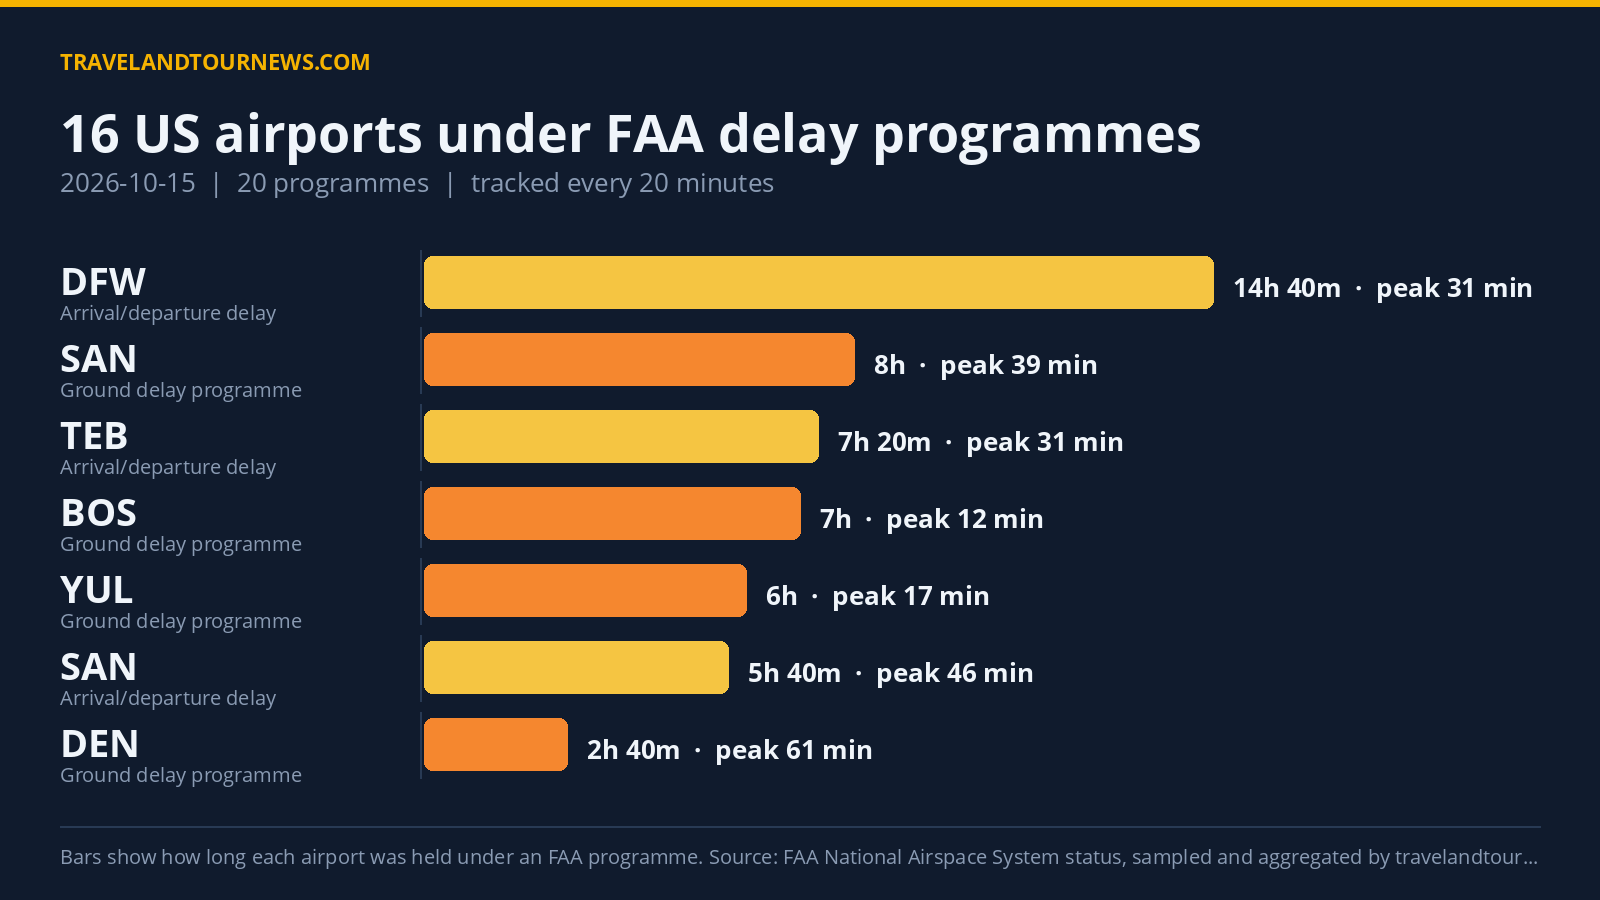
The longest delay programme ran at Dallas/Fort Worth International (DFW) for 14 hours and 40 minutes under general arrival/departure delay information due to thunderstorms. Denver International (DEN) experienced the highest peak average delay of 61 minutes during a 2 hour 40-minute ground delay programme caused
by low ceilings.
Seattle-Tacoma International (SEA) was unique in its ground stop programme, active from 15:20 to 16:20 UTC with low visibility as the reason and no recorded peak delays during that hour. San Diego International (SAN) ran a prolonged eight-hour ground delay programme with airport volume as the cause and peak average delays of 39 minutes. Boston Logan International (BOS) maintained a seven-hour ground delay programme centered on runway construction with peak average delays of 12 minutes.
| Airport | FAA programme | Cause | Peak average delay | In force (UTC) |
|---|---|---|---|---|
| Seattle-Tacoma International (SEA) | Ground Stop Programs | low visibility | – | 15:20 to 16:20 (1 hour) |
| Denver International (DEN) | Ground Stop Programs | low ceilings | – | 14:20 to 15:00 (40 minutes) |
| YVR | Ground Stop Programs | fog | – | 13:00 to 13:20 (20 minutes) |
| San Francisco International (SFO) | Ground Stop Programs | airport volume | – | 16:00 to 16:20 (20 minutes) |
| Denver International (DEN) | Ground Delay Programs | low ceilings | 61 min | 00:00 to 02:40 (2 hours 40 minutes) |
| San Diego International (SAN) | Ground Delay Programs | airport volume | 39 min | 14:00 to 22:00 (8 hours) |
| YYC | Ground Delay Programs | runway construction | 31 min | 22:00 to 22:00 (20 minutes) |
| YUL | Ground Delay Programs | runway construction | 17 min | 16:00 to 22:00 (6 hours) |
| Boston Logan International (BOS) | Ground Delay Programs | runway construction | 12 min | 12:00 to 19:00 (7 hours) |
| San Diego International (SAN) | General Arrival/Departure Delay Info | VOL:Compacted Demand | 46 min | 16:20 to 22:00 (5 hours 40 minutes) |
| Baltimore/Washington International (BWI) | General Arrival/Departure Delay Info | WX:Thunderstorms | 46 min | 00:00 to 01:20 (1 hour 20 minutes) |
| Dallas/Fort Worth International (DFW) | General Arrival/Departure Delay Info | WX:Thunderstorms | 31 min | 00:20 to 15:00 (14 hours 40 minutes) |
| TEB | General Arrival/Departure Delay Info | VOL:Multi-taxi | 31 min | 14:00 to 21:20 (7 hours 20 minutes) |
| John F. Kennedy International (JFK) | General Arrival/Departure Delay Info | RWY:Construction | 16 min | 00:00 to 00:40 (40 minutes) |
Delay Causes and Their Frequency
Runway construction was the most frequent cause, driving 41 recorded delay events across the day. Airport volume issues followed with 27 events,
indicating high demand pressures. Compacted demand and multiple taxi operations accounted for 18 and 13 events respectively, while thunderstorms were the listed cause in 17 delay events.
Ground stop programmes mostly involved weather-related reasons such as low visibility, fog, and low ceilings, affecting SEA, DEN, and YVR. Ground delay programmes predominantly resulted from low ceilings, airport volume, and runway construction. General arrival/departure delay information programmes featured a wider range of causes including thunderstorms, compacted demand, and multiple taxi operations.
Delay Programme Trends Compared to Recent Data
Compared with October 14, 2026, the number of delay programmes decreased slightly by two, from 21 to 20. The number of
affected airports is consistent with the recent seven-day average of 16.4 airports impacted daily and is marginally lower than yesterday’s total of 18 airports. Today’s data does not represent the highest peak delays or longest programmes in the tracking window.
Methodology. travelandtournews.com samples the FAA’s National Airspace System status feed every 20 minutes throughout the US operating day and aggregates the result. This report is built from 64 samples taken between 00:00 and 22:00 UTC on 2026-10-15. Durations are the observed window between the first and last sample in which a programme was in force, so a programme’s true length
may be slightly longer than shown. Ground stops, ground delay programmes, airport closures and general delays are all published by the FAA in real time; the daily aggregation is ours.