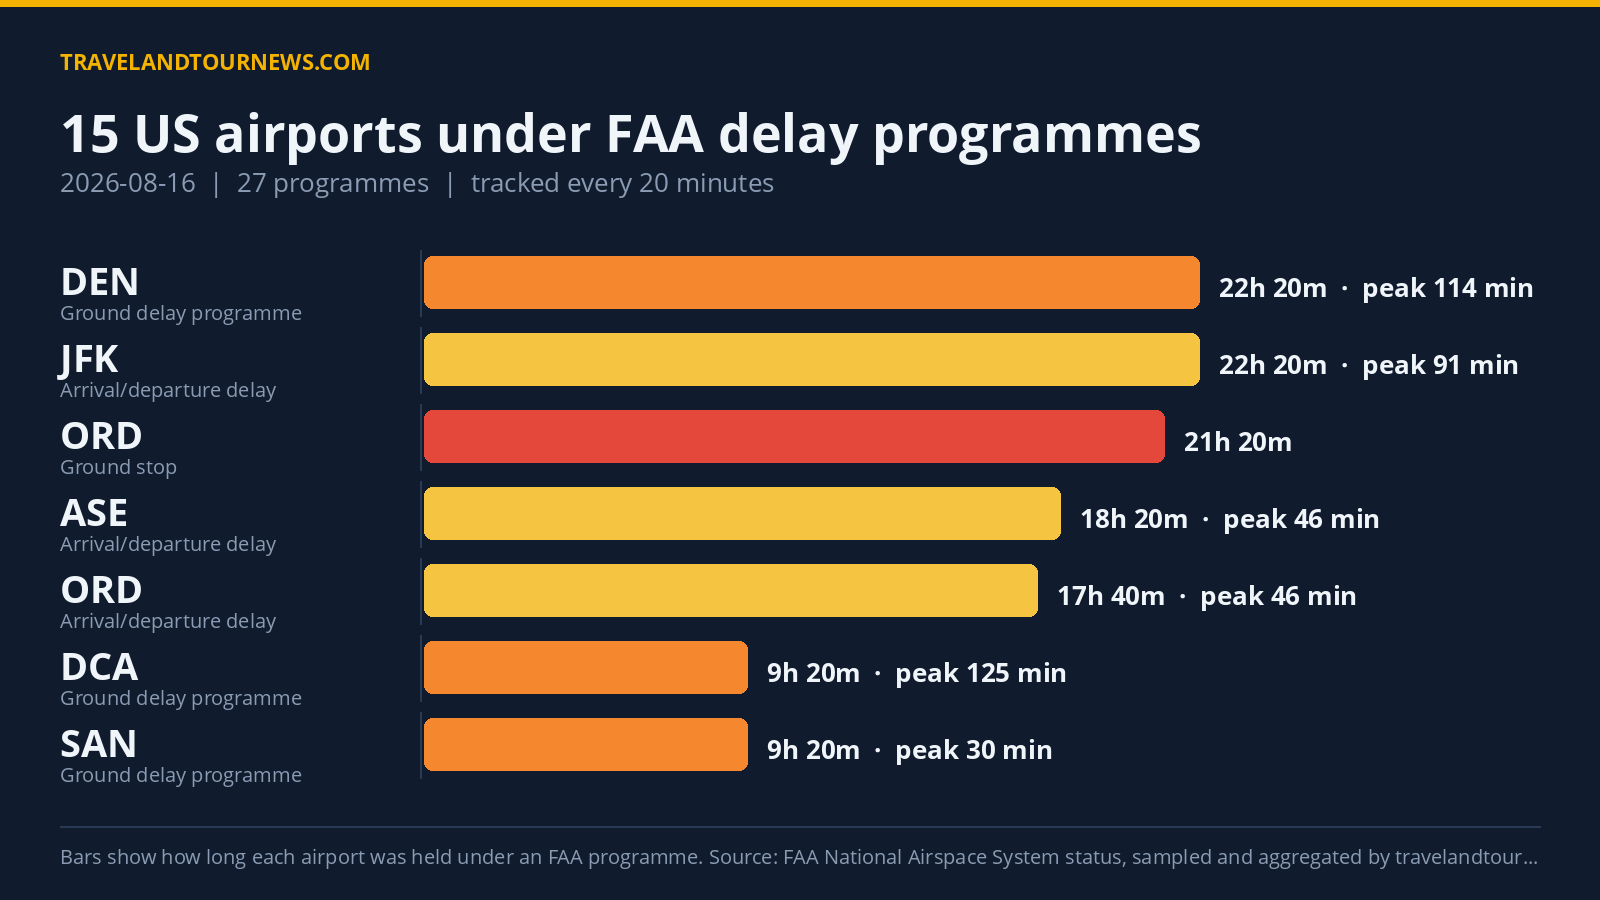

On August 16, 2026, the FAA held 15 airports in the United States under delay programs totaling 27 separate initiatives, according to FAA data tracked by travelandtournews.com. The worst-hit airport was Chicago O’Hare International (ORD), which experienced a peak maximum delay of 1310 minutes.
Delay Programs Across 15 Airports Lasted Up to 22 Hours
The delay programs included four ground stop programs, which hold departures bound for an airport on the ground at their origin, and ten ground delay programs that meter arrivals by assigning later departure times. Additionally, thirteen general arrival and departure delay info programs were recorded.
Chicago O’Hare International (ORD) led with seven samples of ground stop programs active for 21 hours and 20 minutes, attributed to staffing issues, an ongoing air show, and an aircraft emergency. ORD also had 22 samples of ground delay programs spanning 9 hours, driven by the air show alone, with a peak average delay of
113 minutes and a maximum of 1310 minutes.
Denver International (DEN) endured the longest ground delay program, running for 22 hours and 20 minutes with six samples due to thunderstorms. This program reached a peak average delay of 114 minutes and a maximum of 198 minutes.
Philadelphia International (PHL) experienced multiple programs including a short ground stop lasting 20 minutes with low ceilings as the cause, a two-hour ground delay program also due to low ceilings with the peak average delay at 96 minutes, and a general delay info program due to traffic management initiatives lasting 9 hours.
Other airports
with notable ground delay programs include New York JFK and Washington National (DCA), both heavily affected by thunderstorms, and San Diego International (SAN), which faced delays due to airport volume. San Francisco International (SFO) managed a seven-hour program caused by low ceilings.
| Airport | FAA programme | Cause | Peak average delay | In force (UTC) |
|---|---|---|---|---|
| Chicago O’Hare International (ORD) | Ground Stop Programs | STAFFING; air show; aircraft emergency | – | 00:00 to 21:20 (21 hours 20 minutes) |
| Philadelphia International (PHL) | Ground Stop Programs | low ceilings | – | 19:40 to 20:00 (20 minutes) |
| Ronald Reagan Washington National (DCA) | Ground Stop Programs | other | – | 22:20 to 22:20 (20 minutes) |
| Newark Liberty International (EWR) | Ground Stop Programs | thunderstorms | – | 22:20 to 22:20 (20 minutes) |
| John F. Kennedy International (JFK) | Ground Delay Programs | thunderstorms | 127 min | 20:00 to 22:20 (2 hours 20 minutes) |
| Ronald Reagan Washington National (DCA) | Ground Delay Programs | thunderstorms; THUNDERSTORMS | 125 min | 13:00 to 22:20 (9 hours 20 minutes) |
| Denver International (DEN) | Ground Delay Programs | thunderstorms | 114 min | 00:00 to 22:20 (22 hours 20 minutes) |
| Chicago O’Hare International (ORD) | Ground Delay Programs | air show | 113 min | 13:20 to 22:20 (9 hours) |
| Philadelphia International (PHL) | Ground Delay Programs | low ceilings | 96 min | 20:20 to 22:20 (2 hours) |
| LaGuardia (LGA) | Ground Delay Programs | THUNDERSTORMS; thunderstorms | 75 min | 20:20 to 22:20 (2 hours) |
| YUL | Ground Delay Programs | runway obstruction | 56 min | 17:00 to 22:20 (5 hours 20 minutes) |
| Newark Liberty International (EWR) | Ground Delay Programs | thunderstorms | 56 min | 20:40 to 22:20 (1 hour 40 minutes) |
| San Francisco International (SFO) | Ground Delay Programs | low ceilings | 38 min | 12:40 to 19:40 (7 hours) |
| San Diego International (SAN) | Ground Delay Programs | airport volume | 30 min | 13:00 to 22:20 (9 hours 20 minutes) |
Thunderstorms and Traffic Management Initiatives Led in Delay Causes
FAA’s stated reasons for these programs identified weather-related factors and operational measures as primary causes. The leading cause was traffic management initiatives linked to the SWAP weather plan (TM Initiatives:SWAP:WX), cited 81 times across programs. Thunderstorms accounted for 55 citations, while low ceiling conditions were referenced 31 times.
Airport volume constraints and a notable air show each contributed
to nearly 30 and 26 citations respectively. Other reasons included runway obstruction and specific emergency events such as aircraft emergencies at ORD.
Stable Delay Situation Compared to Previous Day and Recent Average
The August 16 delay programs represented a slight increase over the previous day, with one more program reported (27 versus 21) and one additional airport affected (15 versus 14). This was however below the seven-day average of 19.1 affected airports. This day was not the worst in the recent tracking window.
Methodology. travelandtournews.com samples the FAA’s National Airspace System status feed every 20 minutes throughout the US operating day and aggregates the result. This report is built from
68 samples taken between 00:00 and 22:20 UTC on 2026-08-16. Durations are the observed window between the first and last sample in which a programme was in force, so a programme’s true length may be slightly longer than shown. Ground stops, ground delay programmes, airport closures and general delays are all published by the FAA in real time; the daily aggregation is ours.