
On September 17, 2026, the FAA held 21 airports across the United States under 33 delay programs in total, according to FAA data tracked by travelandtournews.com. Chicago O’Hare International (ORD) was the worst affected airport, with a peak maximum delay reaching 570 minutes during ground delay operations.
FAA Delay Program Types and Airport Impact
Among the 33 programs, 10 were ground stop programs and 8 were ground delay programs, while the remaining 15 provided general arrival and departure delay information. A ground stop holds departures destined for an airport on the ground, preventing them from leaving, whereas a ground delay program meters arrivals by assigning later departure times.
Chicago O’Hare (ORD) experienced two types of programs: a ground stop lasting 8 hours and 20 minutes from 09:40 to 18:00 caused by thunderstorms and wind, and a ground delay program lasting 8 hours and 40 minutes with peak average delays of 126 minutes and maximum
delays up to 570 minutes. Chicago Midway (MDW) had an 11-sample ground stop for thunderstorms and a 2-hour ground delay program with peak average delay of 145 minutes.
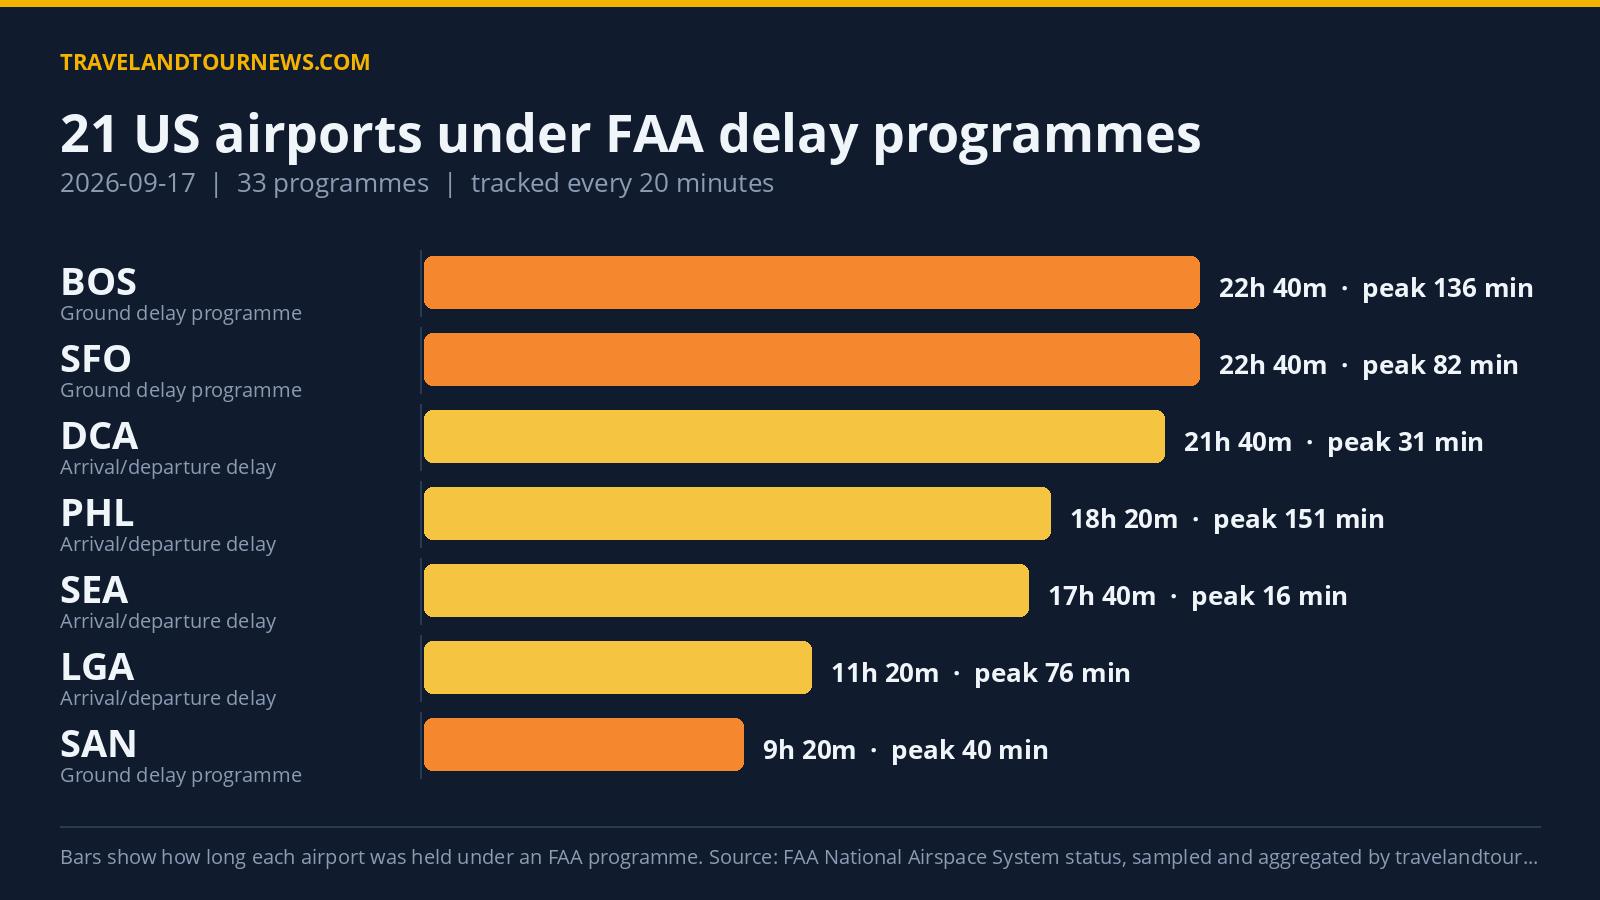
Boston Logan International (BOS) endured the longest ground delay program of the day, running for 22 hours and 40 minutes due to runway construction with peak average delays of 136 minutes and maximum delays of 386 minutes. San Francisco International (SFO) also faced a long ground delay program for 22 hours and 40 minutes caused by low ceilings, reaching a peak average delay of 82 minutes.
Several other airports were affected by
ground stops lasting between 20 to 40 minutes due to thunderstorms, wind, low ceilings, or runway construction, including Washington National (DCA), Baltimore/Washington (BWI), Washington Dulles (IAD), Austin (AUS), Denver (DEN), and YUL. San Diego (SAN) experienced a 9 hour and 20 minute ground delay program due to airport volume, while Seattle-Tacoma (SEA) faced a short 20-minute ground delay due to runway construction.
| Airport | FAA programme | Cause | Peak average delay | In force (UTC) |
|---|---|---|---|---|
| Chicago O’Hare International (ORD) | Ground Stop Programs | thunderstorms; wind | – | 09:40 to 18:00 (8 hours 20 minutes) |
| Chicago Midway International (MDW) | Ground Stop Programs | thunderstorms | – | 10:40 to 14:00 (3 hours 20 minutes) |
| Ronald Reagan Washington National (DCA) | Ground Stop Programs | thunderstorms | – | 18:20 to 19:00 (40 minutes) |
| Baltimore/Washington International (BWI) | Ground Stop Programs | thunderstorms | – | 18:20 to 19:00 (40 minutes) |
| Washington Dulles International (IAD) | Ground Stop Programs | thunderstorms | – | 18:20 to 19:00 (40 minutes) |
| AUS | Ground Stop Programs | runway construction | – | 19:40 to 20:20 (40 minutes) |
| Denver International (DEN) | Ground Stop Programs | other | – | 00:00 to 00:20 (20 minutes) |
| San Francisco International (SFO) | Ground Stop Programs | low ceilings | – | 03:20 to 03:40 (20 minutes) |
| YUL | Ground Stop Programs | other | – | 19:40 to 20:00 (20 minutes) |
| Harry Reid International (LAS) | Ground Stop Programs | wind | – | 20:20 to 20:20 (20 minutes) |
| Chicago Midway International (MDW) | Ground Delay Programs | other | 145 min | 14:20 to 16:20 (2 hours) |
| Boston Logan International (BOS) | Ground Delay Programs | runway construction | 136 min | 00:00 to 22:40 (22 hours 40 minutes) |
| Chicago O’Hare International (ORD) | Ground Delay Programs | thunderstorms; wind | 126 min | 12:00 to 20:40 (8 hours 40 minutes) |
| San Francisco International (SFO) | Ground Delay Programs | low ceilings | 82 min | 00:00 to 22:40 (22 hours 40 minutes) |
Some airports had only general arrival or departure delay advisories without full ground stop or delay programs. Philadelphia International (PHL) had 18 samples with delays averaging 151 minutes attributable to thunderstorms and traffic management initiatives related to weather. LaGuardia (LGA) had 20 samples influenced by traffic management initiatives, while airports like Teterboro (TEB) and Washington Dulles (IAD) faced weather-related delay advisories.
Thunderstorms and Weather Dominate Delay Causes
The dominant driver for delays was thunderstorms and related weather issues as recorded directly in FAA data. Thunderstorms accounted for 63 of the delay-related programs, appearing either under the terms “thunderstorms,” “WX:Thunderstorms,” or grouped with traffic management initiatives
flagged “TM Initiatives:SWAP:WX,” also tallying 63. Low ceilings caused 45 delay programs, while runway construction was listed in 39. Wind was a contributing cause at locations including ORD and Las Vegas (LAS). Other causes included airport volume and unspecified other reasons.
Delay Program Trends Compared to Recent Days
The day’s 21 airports affected and 33 delay programs marked an increase over the previous day’s 14 airports and 17 programs, adding 7 more programs overall. The 21 airports also exceeded the seven-day average of 15.9 airports affected. This makes September 17 the highest airport count and number of programs in the tracking window as compiled by travelandtournews.com from
FAA data.
Methodology. travelandtournews.com samples the FAA’s National Airspace System status feed every 20 minutes throughout the US operating day and aggregates the result. This report is built from 69 samples taken between 00:00 and 22:40 UTC on 2026-09-17. Durations are the observed window between the first and last sample in which a programme was in force, so a programme’s true length may be slightly longer than shown. Ground stops, ground delay programmes, airport closures and general delays are all published by the FAA in real time; the daily aggregation is ours.