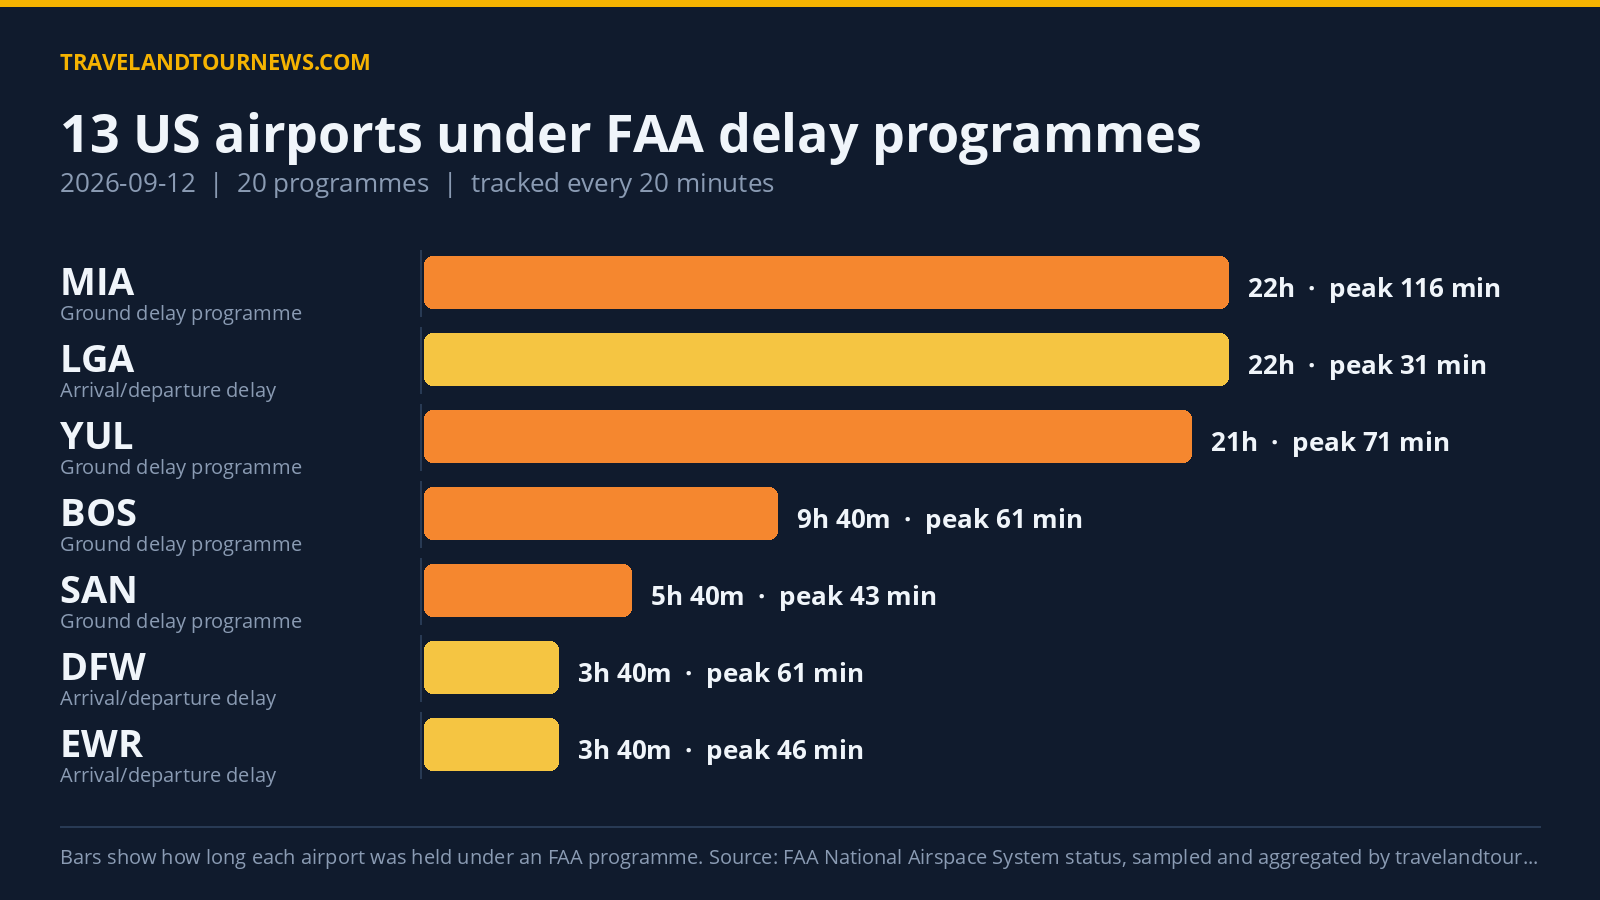

On September 12, 2026, the FAA managed delay programs affecting 13 airports across the United States, implementing 20 programs in total. Orlando International Airport (MCO) experienced the most severe disruption with a ground stop program due to thunderstorms observed for 1 hour and 20 minutes, although recorded delays at MCO peaked at 0 minutes during this period.
Delay Program Details and Impact at Key US Airports
The 13 affected airports included ATL, AUS, BOS, DFW, EWR, LGA, MCO, MIA, PHL, SAN, SFO, TEB, and YUL. The FAA issued 2 ground stop programs and 9 ground delay programs, while 9 programs conveyed general arrival and departure delay information. A ground stop holds departures destined for the affected airport on the ground at their point of origin. Ground delay programs meter arrivals by assigning later departure times.
The longest program was the ground delay program at Miami International (MIA), lasting 22 hours due to a disabled aircraft on the runway. MIA saw peak average delays of 116 minutes
and maximum delays up to 237 minutes over this period.
Orlando International’s ground stop program caused by thunderstorms was observed from 20:40 to 22:00 (80 minutes). While MCO’s peak average delay was 0 minutes during the ground stop, a subsequent general arrival/departure delay information program related to weather mitigation initiatives (MIT:WX) ran for 1 hour with peak average delays of 31 minutes and peak maximum delays of 45 minutes.
Other airports with notable ground delay programs include Hartsfield-Jackson Atlanta International (ATL), which faced thunderstorms causing a 1 hour and 40 minutes ground delay program with peak average delays of 107
minutes and a 271-minute maximum delay. Austin Bergstrom (AUS) also had both a ground stop and ground delay program related to thunderstorms, with the ground delay program lasting 1 hour and peak maximum delays hitting 200 minutes.
San Diego International (SAN) encountered a ground delay program due to airport volume lasting 5 hours and 40 minutes, with peak average delays of 43 minutes and maximum delays up to 169 minutes. Boston Logan International (BOS), New York’s Newark Liberty (EWR), and Montreal (YUL) all operated ground delay programs caused primarily by “other” reasons from the FAA, lasting several hours each with
peak average delays ranging from 59 to 71 minutes.
| Airport | FAA programme | Cause | Peak average delay | In force (UTC) |
|---|---|---|---|---|
| Orlando International (MCO) | Ground Stop Programs | thunderstorms | – | 20:40 to 22:00 (1 hour 20 minutes) |
| AUS | Ground Stop Programs | thunderstorms | – | 00:00 to 00:00 (20 minutes) |
| Miami International (MIA) | Ground Delay Programs | disabled aircraft on the runway | 116 min | 00:00 to 22:00 (22 hours) |
| TEB | Ground Delay Programs | STAFFING | 116 min | 00:00 to 01:00 (1 hour) |
| Hartsfield-Jackson Atlanta International (ATL) | Ground Delay Programs | thunderstorms | 107 min | 00:00 to 01:40 (1 hour 40 minutes) |
| YUL | Ground Delay Programs | other | 71 min | 00:00 to 21:00 (21 hours) |
| Boston Logan International (BOS) | Ground Delay Programs | other | 61 min | 12:20 to 22:00 (9 hours 40 minutes) |
| Newark Liberty International (EWR) | Ground Delay Programs | other | 59 min | 00:00 to 01:40 (1 hour 40 minutes) |
| AUS | Ground Delay Programs | thunderstorms | 59 min | 00:00 to 01:00 (1 hour) |
| San Diego International (SAN) | Ground Delay Programs | airport volume | 43 min | 00:00 to 05:40 (5 hours 40 minutes) |
| San Francisco International (SFO) | Ground Delay Programs | other | 41 min | 21:40 to 22:00 (20 minutes) |
| Dallas/Fort Worth International (DFW) | General Arrival/Departure Delay Info | TM Initiatives:SWAP:WX | 61 min | 00:00 to 03:40 (3 hours 40 minutes) |
| Newark Liberty International (EWR) | General Arrival/Departure Delay Info | STAFF:Staffing | 46 min | 00:00 to 03:40 (3 hours 40 minutes) |
| LaGuardia (LGA) | General Arrival/Departure Delay Info | TM Initiatives:SWAP:WX | 31 min | 00:00 to 22:00 (22 hours) |
FAA-Cited Causes Behind Delay Programs
The FAA’s official listed reasons drove the delay programs. The most frequent cause category was “other,” accounting for 35 instances, affecting multiple airports including BOS, EWR, and YUL. Disabled aircraft on runways accounted for 31 programs, all observed at Miami International (MIA).
Thunderstorms were a factor in 16 programs, impacting airports such as Orlando International (MCO), Austin Bergstrom (AUS), Atlanta (ATL), and Philadelphia International (PHL). Airport volume led to 18 programs notably at San Diego International (SAN).
Additional causes included staffing shortages noted at Teterboro Airport (TEB) and Newark Liberty (EWR),
runway construction delays at Boston Logan (BOS) and San Francisco International (SFO), and air traffic management initiatives labeled as TM Initiatives:SWAP:WX affecting Dover Fort Worth (DFW) and LaGuardia (LGA).
Comparing September 12 Data to Previous Day and Weekly Average
Compared with the previous day, September 11, 2026, the number of airports affected dropped from 18 to 13, and the total number of delay programs decreased by five from 25 to 20. The current count on September 12 aligns closely with the seven-day trailing average of 13.9 airports affected, confirming a moderate level of delay activity on this day. The FAA delay activity on September 12 was not the highest in
the recent tracking window.
Methodology. travelandtournews.com samples the FAA’s National Airspace System status feed every 20 minutes throughout the US operating day and aggregates the result. This report is built from 53 samples taken between 00:00 and 22:00 UTC on 2026-09-12. Durations are the observed window between the first and last sample in which a programme was in force, so a programme’s true length may be slightly longer than shown. Ground stops, ground delay programmes, airport closures and general delays are all published by the FAA in real time; the daily aggregation is ours.