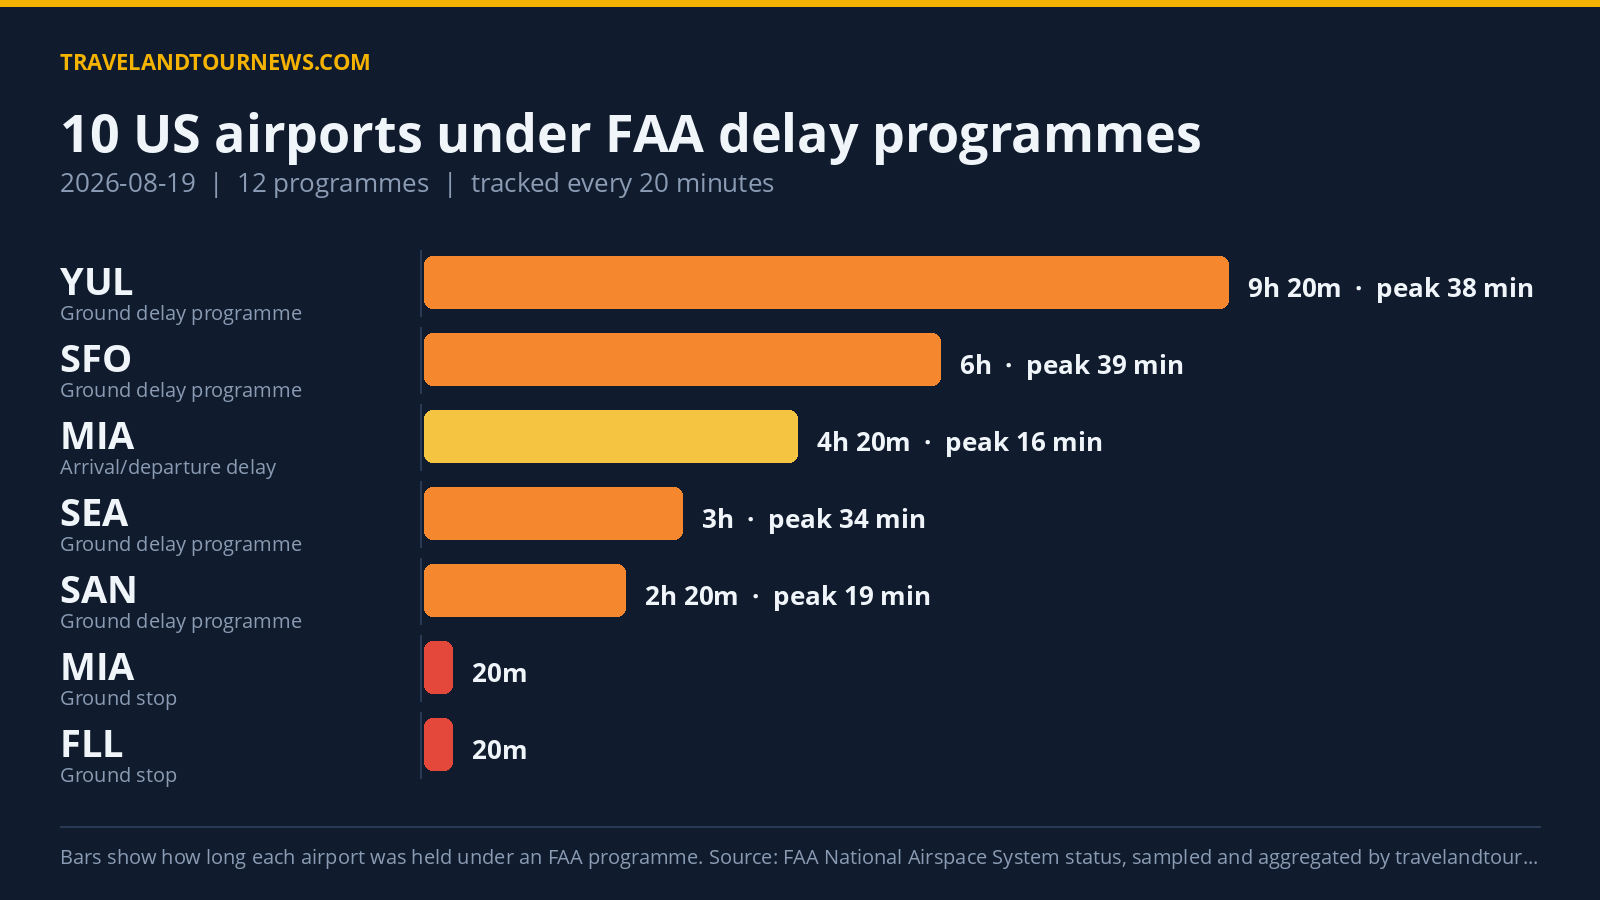

On August 19, 2026, the Federal Aviation Administration (FAA) implemented a total of 12 delay programs across 10 United States airports, as tracked by travelandtournews.com. Miami International Airport (MIA) experienced the worst conditions, facing ground stop programs triggered by thunderstorms, though without recorded peak delays.
Ten US Airports Experienced FAA Delay Programs on August 19
The affected airports were Boston Logan International (BOS), Baltimore/Washington International (BWI), Newark Liberty International (EWR), Fort Lauderdale-Hollywood International (FLL), Miami International (MIA), Phoenix Sky Harbor International (PHX), San Diego International (SAN), Seattle-Tacoma International (SEA), San Francisco International (SFO), and Montreal-Pierre Elliott Trudeau (YUL).
The FAA enforced 2 Ground Stop Programs, which hold departures destined for an airport on the ground at their origin to manage congestion and delays. Four Ground Delay Programs were active; these meter arrivals by assigning later departure times to spacing inbound traffic. The remaining 6 programs provided general arrival and departure delay information without imposing explicit
holds or delays on departures.
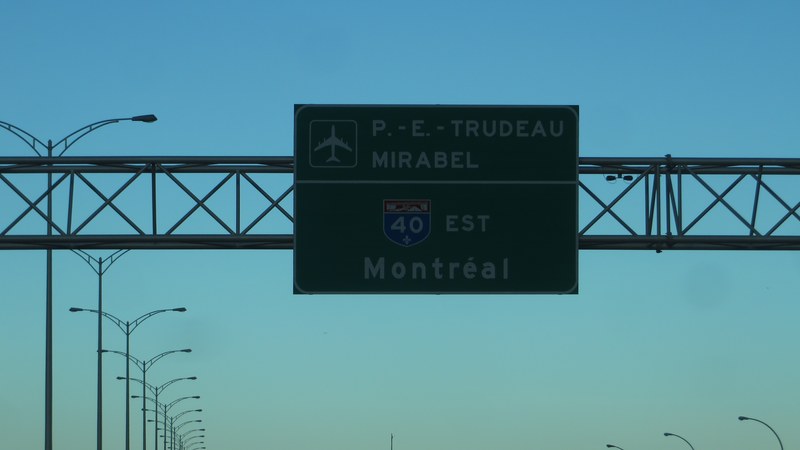
The longest-running program was the Ground Delay Program at Montreal (YUL), observed for 9 hours 20 minutes, driven by causes labelled “other.” San Francisco International underwent a Ground Delay Program caused by low ceilings for 6 hours, with peak average delays of 39 minutes and a maximum delay of 84 minutes. Seattle-Tacoma’s Ground Delay Program, also due to low ceilings, lasted 3 hours with peak average and maximum delays of 34 and 96 minutes respectively. San Diego’s Ground Delay Program, attributed to airport volume, was in effect for 2 hours 20 minutes with peak average
delays of 19 minutes.
| Airport | FAA programme | Cause | Peak average delay | In force (UTC) |
|---|---|---|---|---|
| Miami International (MIA) | Ground Stop Programs | thunderstorms | – | 22:20 to 22:20 (20 minutes) |
| Fort Lauderdale-Hollywood International (FLL) | Ground Stop Programs | thunderstorms | – | 22:20 to 22:20 (20 minutes) |
| San Francisco International (SFO) | Ground Delay Programs | low ceilings | 39 min | 12:40 to 18:40 (6 hours) |
| YUL | Ground Delay Programs | other | 38 min | 13:00 to 22:20 (9 hours 20 minutes) |
| Seattle-Tacoma International (SEA) | Ground Delay Programs | low ceilings | 34 min | 13:40 to 16:40 (3 hours) |
| San Diego International (SAN) | Ground Delay Programs | airport volume | 19 min | 16:20 to 18:40 (2 hours 20 minutes) |
| Boston Logan International (BOS) | General Arrival/Departure Delay Info | WX:Wind | 46 min | 22:00 to 22:20 (20 minutes) |
| Miami International (MIA) | General Arrival/Departure Delay Info | VOL:Compacted Demand | 16 min | 11:40 to 16:00 (4 hours 20 minutes) |
| Baltimore/Washington International (BWI) | General Arrival/Departure Delay Info | RWY:Construction | 16 min | 11:20 to 11:20 (20 minutes) |
| Phoenix Sky Harbor International (PHX) | General Arrival/Departure Delay Info | TM Initiatives:MIT:VOL | 16 min | 16:20 to 16:40 (20 minutes) |
| Newark Liberty International (EWR) | General Arrival/Departure Delay Info | TM Initiatives:Metering:DCA | 16 min | 17:40 to 17:40 (20 minutes) |
| San Francisco International (SFO) | General Arrival/Departure Delay Info | RWY:Construction | 16 min | 22:00 to 22:20 (20 minutes) |
Thunderstorms Drove Ground Stops at Miami and Fort Lauderdale
Miami International and Fort Lauderdale-Hollywood International Airports each imposed a Ground Stop Program related to thunderstorms starting at 22:20 UTC, observed for 20 minutes each. Despite the ground stops, no average or maximum delays were recorded during that short interval for these programs.
Boston Logan International faced general arrival/departure delays due to wind, with peak average delays reaching 46 minutes and a maximum delay of 60 minutes over a 20-minute span. Miami also experienced general delay information related to compacted demand for 4 hours 20 minutes, with delays peaking at 16 minutes average and 30 minutes
maximum.
Baltimore/Washington International had a brief 20-minute general delay program caused by runway construction, and Phoenix Sky Harbor saw a similar 20-minute delay related to traffic management initiatives involving volume. Newark Liberty’s delays were linked to traffic metering for Washington D.C. arrivals, also lasting 20 minutes.
Low Ceilings and Other Causes Were Leading Factors
The FAA identified low ceilings as the most frequent cause across delay programs, appearing in 29 of the aggregated samples. Other reasons accounted for 17 samples, followed by compacted demand at 11, airport volume at 8, and runway construction at 3.
Low ceilings primarily affected the Ground Delay Programs at San Francisco and Seattle-Tacoma.
Thunderstorms exclusively caused the Ground Stop Programs at Miami and Fort Lauderdale. Compacted demand featured prominently in Miami’s general delay information, while airport volume delayed operations at San Diego. Construction-related delays appeared at Baltimore/Washington and San Francisco.
Decline in Delay Programs Compared to Previous Day
Compared with August 18, when 17 airports were affected by 26 delay programs, August 19 saw reductions to 10 airports and 12 programs. This represents a decrease of 7 programs. The 10 airports delayed on August 19 were also fewer than the recent seven-day average of 17.6 airports affected daily. August 19 was not the worst day within the recent tracking window.
Data
credits: FAA National Airspace System status feed, sampled all day by travelandtournews.com.
Methodology. travelandtournews.com samples the FAA’s National Airspace System status feed every 20 minutes throughout the US operating day and aggregates the result. This report is built from 65 samples taken between 00:00 and 22:20 UTC on 2026-08-19. Durations are the observed window between the first and last sample in which a programme was in force, so a programme’s true length may be slightly longer than shown. Ground stops, ground delay programmes, airport closures and general delays are all published by the FAA in real time; the daily aggregation
is ours.