
On September 1, 2026, FAA delay programs held 19 airports across the United States under operational restrictions with a total of 29 programs in force. The worst-affected airport was LaGuardia (LGA), where ground stop programs due to airspace volume and thunderstorms persisted for five hours.
Airport Delays and Program Types on 2026-09-01
Nineteen airports were under delay control measures across the US market. The FAA implemented seven Ground Stop Programs, which restrict departures bound for an affected airport at their origin, and seven Ground Delay Programs that meter arrivals by assigning later departure times. Additionally, 15 programs provided general arrival or departure delay information.
LaGuardia (LGA) experienced the longest and most concentrated ground stop program from 17:40 to 22:40 UTC (5 hours), with seven samples recorded. This program was driven by issues of airspace volume compounded by thunderstorms. Despite the extended duration, the peak recorded delays at LGA registered at zero average
or maximum delay minutes in this ground stop category, indicating the program’s nature focused on controlling departure flows rather than measuring delay buildup from arrivals waiting on the ground.
The Toronto Pearson Airport (YYZ) observed an early morning ground stop caused by dense fog lasting two hours and 20 minutes. New York-area airports including Newark Liberty (EWR) and John F. Kennedy International (JFK) had both ground stop and ground delay programs primarily due to thunderstorms, with delays lasting from 40 minutes up to over six hours combined.
Chicago O’Hare International (ORD) was subjected to multiple programs: a short ground stop
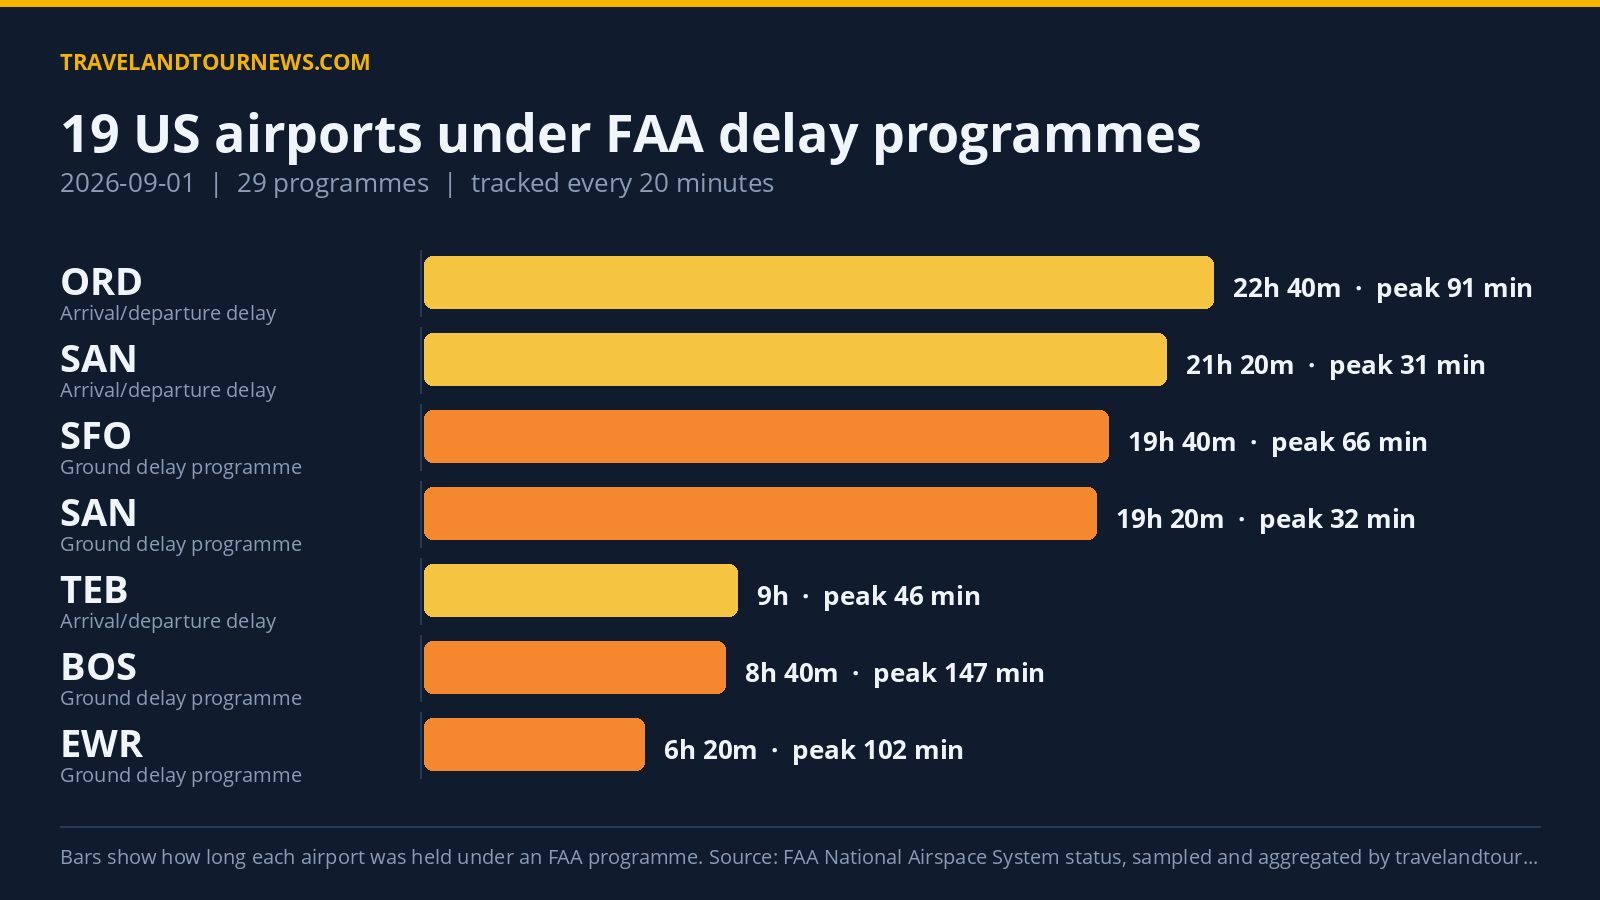
early in the day and a ground delay program lasting two hours and 40 minutes with a peak average delay of 241 minutes and maximum delay reaching 1,132 minutes. ORD also had a nearly full-day general arrival/departure delay info program related to thunderstorms.
Boston Logan International (BOS) faced a ground delay due to runway construction lasting eight hours and 40 minutes, with peak average delay of 147 minutes. San Diego International (SAN) recorded long ground delay programs due to airport volume totaling over 19 hours and 20 minutes, consistently registering average delays around 30 minutes.
Other airports with relevant ground
delays included San Francisco International (SFO) due to low ceilings for nearly 20 hours, and LaGuardia again under ground delay for thunderstorms, lasting 4 hours and 40 minutes with average delays peaking at 45 minutes.
| Airport | FAA programme | Cause | Peak average delay | In force (UTC) |
|---|---|---|---|---|
| LaGuardia (LGA) | Ground Stop Programs | airspace volume; thunderstorms | – | 17:40 to 22:40 (5 hours) |
| YYZ | Ground Stop Programs | fog | – | 01:20 to 03:40 (2 hours 20 minutes) |
| Newark Liberty International (EWR) | Ground Stop Programs | thunderstorms | – | 21:40 to 22:40 (1 hour) |
| John F. Kennedy International (JFK) | Ground Stop Programs | thunderstorms | – | 22:00 to 22:40 (40 minutes) |
| Chicago O’Hare International (ORD) | Ground Stop Programs | thunderstorms | – | 00:00 to 00:00 (20 minutes) |
| Tampa International (TPA) | Ground Stop Programs | thunderstorms | – | 22:00 to 22:20 (20 minutes) |
| TEB | Ground Stop Programs | thunderstorms | – | 22:20 to 22:40 (20 minutes) |
| Chicago O’Hare International (ORD) | Ground Delay Programs | thunderstorms | 241 min | 00:00 to 02:40 (2 hours 40 minutes) |
| Boston Logan International (BOS) | Ground Delay Programs | runway construction | 147 min | 14:00 to 22:40 (8 hours 40 minutes) |
| John F. Kennedy International (JFK) | Ground Delay Programs | thunderstorms | 113 min | 16:00 to 20:40 (4 hours 40 minutes) |
| Newark Liberty International (EWR) | Ground Delay Programs | thunderstorms | 102 min | 16:20 to 22:40 (6 hours 20 minutes) |
| San Francisco International (SFO) | Ground Delay Programs | low ceilings | 66 min | 00:00 to 19:40 (19 hours 40 minutes) |
| LaGuardia (LGA) | Ground Delay Programs | thunderstorms | 45 min | 16:00 to 20:40 (4 hours 40 minutes) |
| San Diego International (SAN) | Ground Delay Programs | airport volume | 32 min | 00:00 to 19:20 (19 hours 20 minutes) |
Thunderstorms Drove Most Delay Programs
The primary cause behind the delay programs remained weather-related, with thunderstorms identified as the leading reason, associated with 75 program samples. Low ceilings accounted for 38 samples, while airport volume restrictions appeared in 28, and runway construction affected 27.
Other notable reasons include TM Initiatives labeled SWAP WX for traffic management under weather influence (18 samples), fog at Toronto Pearson, and isolated events such as
an aircraft emergency at Philadelphia International (PHL). The causes align tightly with FAA’s stated reasons tied to specific delay programs.
Comparison to Previous Day and Recent Averages
Compared to the previous day, September 1 saw a slight increase in the number of affected airports, rising from 17 to 19. Total programs also increased from 27 to 29. This is also above the recent 7-day average of 17.3 affected airports.
This data indicates a modest uptick in delay program activity but does not represent the highest in the tracking window.
Methodology. travelandtournews.com samples the FAA’s National Airspace System status feed every 20 minutes throughout the US operating day
and aggregates the result. This report is built from 69 samples taken between 00:00 and 22:40 UTC on 2026-09-01. Durations are the observed window between the first and last sample in which a programme was in force, so a programme’s true length may be slightly longer than shown. Ground stops, ground delay programmes, airport closures and general delays are all published by the FAA in real time; the daily aggregation is ours.