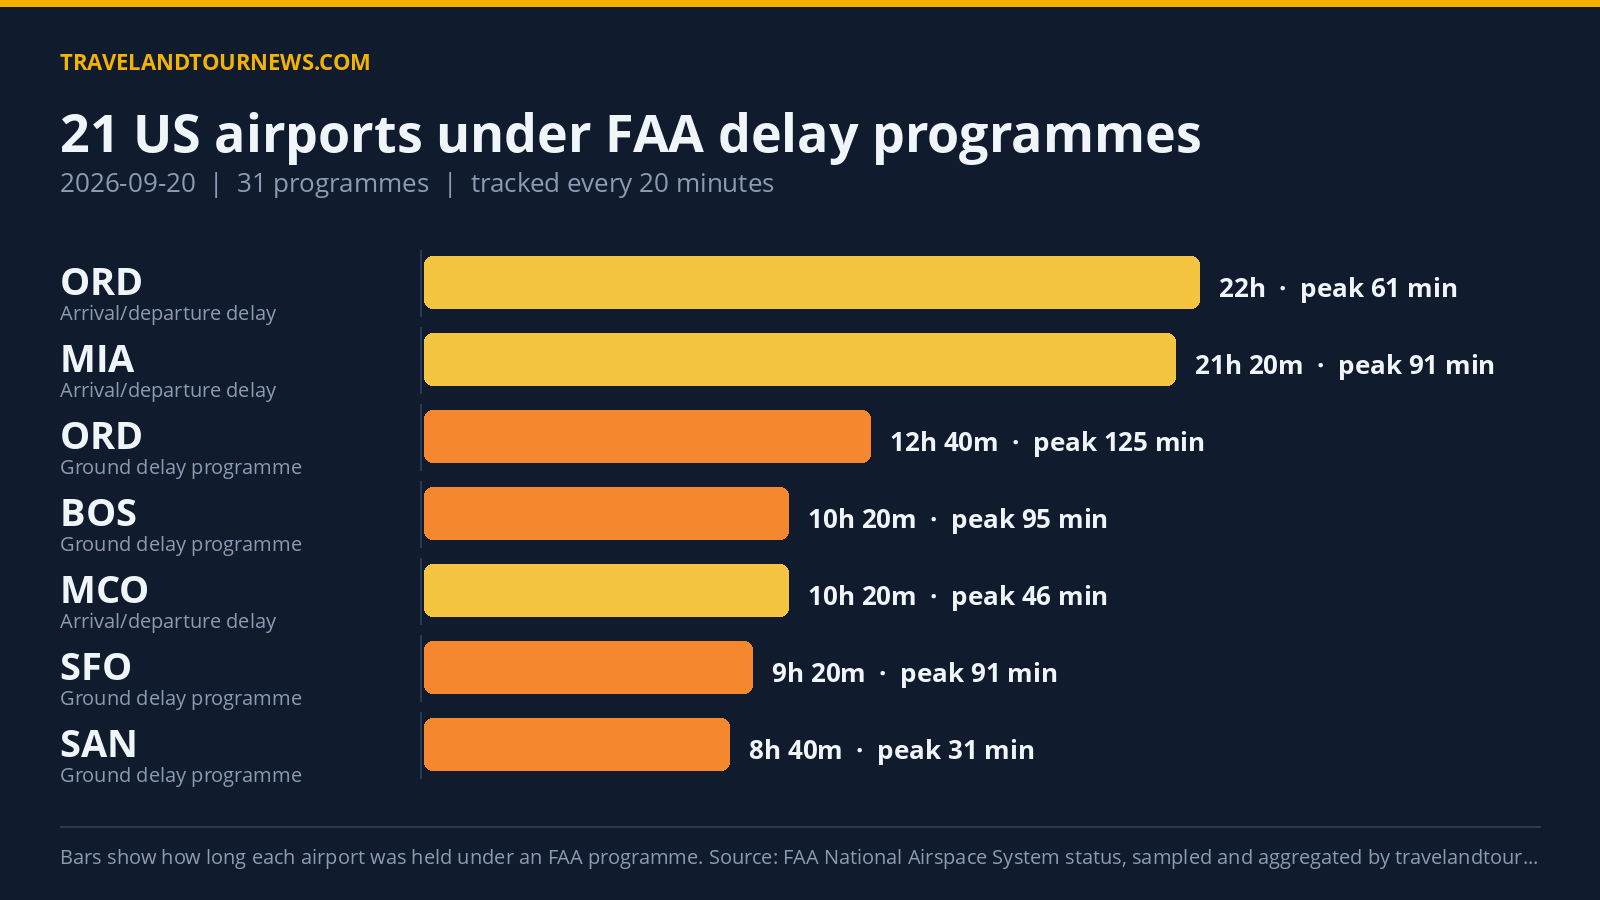

On September 20, 2026, 21 airports across the United States were impacted by 31 FAA delay programs, according to data aggregated from the FAA’s official feed. The worst-hit airport was Chicago O’Hare International (ORD), which experienced a peak average delay of 125 minutes during its ground delay program and a ground stop lasting over 7 hours.
Chicago O’Hare, Boston, and San Francisco Led In Delay Program Duration and Severity
The FAA deployed multiple types of delay programs, including 9 ground stop programs, 8 ground delay programs, and 14 general arrival/departure delay notices. Ground stops hold departures bound for an airport on the ground at their origin, while ground delay programs meter arrivals by assigning later departure times.
Chicago O’Hare International (ORD) had the longest ground stop, active from 03:40 to 11:00 UTC, lasting 7 hours and 20 minutes, caused by staffing shortages and thunderstorms. ORD also had a ground delay program from 00:00 to 12:40 UTC spanning 12 hours and 40 minutes, with a peak average delay of 125
minutes and a peak maximum delay of 305 minutes.
Boston Logan International (BOS) was under a ground delay program for 10 hours and 20 minutes starting at 12:20 UTC with 32 samples taken. The program’s cause was listed as “other” reasons by the FAA, reaching a peak average delay of 95 minutes and a peak maximum delay of 199 minutes.
San Francisco International (SFO) had both ground stops and ground delay programs related to low ceilings. The ground stop lasted 20 minutes starting at 19:00 UTC, while the ground delay program spanned 9 hours and 20 minutes from 13:20 to
22:40 UTC. SFO’s peak average delay during the ground delay program was 91 minutes, with a peak maximum delay of 442 minutes, the highest max delay recorded across all programs.
| Airport | FAA programme | Cause | Peak average delay | In force (UTC) |
|---|---|---|---|---|
| Chicago O’Hare International (ORD) | Ground Stop Programs | STAFFING; thunderstorms | – | 03:40 to 11:00 (7 hours 20 minutes) |
| Hartsfield-Jackson Atlanta International (ATL) | Ground Stop Programs | thunderstorms | – | 00:00 to 00:40 (40 minutes) |
| Tampa International (TPA) | Ground Stop Programs | thunderstorms | – | 21:20 to 22:00 (40 minutes) |
| William P. Hobby (HOU) | Ground Stop Programs | runway maintenance | – | 14:40 to 14:40 (20 minutes) |
| Fort Lauderdale-Hollywood International (FLL) | Ground Stop Programs | thunderstorms | – | 18:20 to 18:40 (20 minutes) |
| San Francisco International (SFO) | Ground Stop Programs | low ceilings | – | 19:00 to 19:20 (20 minutes) |
| TEB | Ground Stop Programs | low ceilings | – | 20:00 to 20:00 (20 minutes) |
| Dallas Love Field (DAL) | Ground Stop Programs | thunderstorms | – | 20:40 to 20:40 (20 minutes) |
| Dallas/Fort Worth International (DFW) | Ground Stop Programs | thunderstorms | – | 21:20 to 21:40 (20 minutes) |
| Chicago O’Hare International (ORD) | Ground Delay Programs | thunderstorms | 125 min | 00:00 to 12:40 (12 hours 40 minutes) |
| Boston Logan International (BOS) | Ground Delay Programs | other | 95 min | 12:20 to 22:40 (10 hours 20 minutes) |
| San Francisco International (SFO) | Ground Delay Programs | low ceilings | 91 min | 13:20 to 22:40 (9 hours 20 minutes) |
| TEB | Ground Delay Programs | low ceilings | 73 min | 20:20 to 22:00 (1 hour 40 minutes) |
| YYZ | Ground Delay Programs | other | 48 min | 15:20 to 18:20 (3 hours) |
Thunderstorms and Low Ceilings Drove Nearly Half of the Delay Programs
The FAA cited 31 programs on September 20, with causes grouped as follows: 42 programs listed “other” reasons, 38 were due to thunderstorms, 38 due to low ceilings, 30 linked to traffic management initiatives related to weather, and 27 attributed to airport volume.
Thunderstorms were the predominant cause of ground stops, affecting airports such as ATL, TPA, DAL, DFW, FLL, and ORD. Low ceilings mainly affected West Coast airports including
SFO and TEB, impacting both ground stops and ground delay programs.
Airport volume was a key factor for San Diego International (SAN) over nearly nine hours of ground delay programs, while runway maintenance and construction affected Houston Hobby (HOU) and Seattle-Tacoma (SEA) respectively.
FAA Delay Programs Increased Compared to Yesterday and Weekly Average
Compared to the previous day, September 19, which had 11 airports affected and 17 programs in total, September 20 saw an increase of 10 affected airports and 14 additional programs. The seven-day average before September 20 was 16 airports affected, indicating today’s figure of 21 is above average.
Despite this increase, September 20 does not represent the
worst in the recent tracking window. The longest continuous observed delay program was 22 hours at Chicago O’Hare, combining general delay information and ground stops.
Methodology. travelandtournews.com samples the FAA’s National Airspace System status feed every 20 minutes throughout the US operating day and aggregates the result. This report is built from 69 samples taken between 00:00 and 22:40 UTC on 2026-09-20. Durations are the observed window between the first and last sample in which a programme was in force, so a programme’s true length may be slightly longer than shown. Ground stops, ground delay programmes, airport closures and general
delays are all published by the FAA in real time; the daily aggregation is ours.