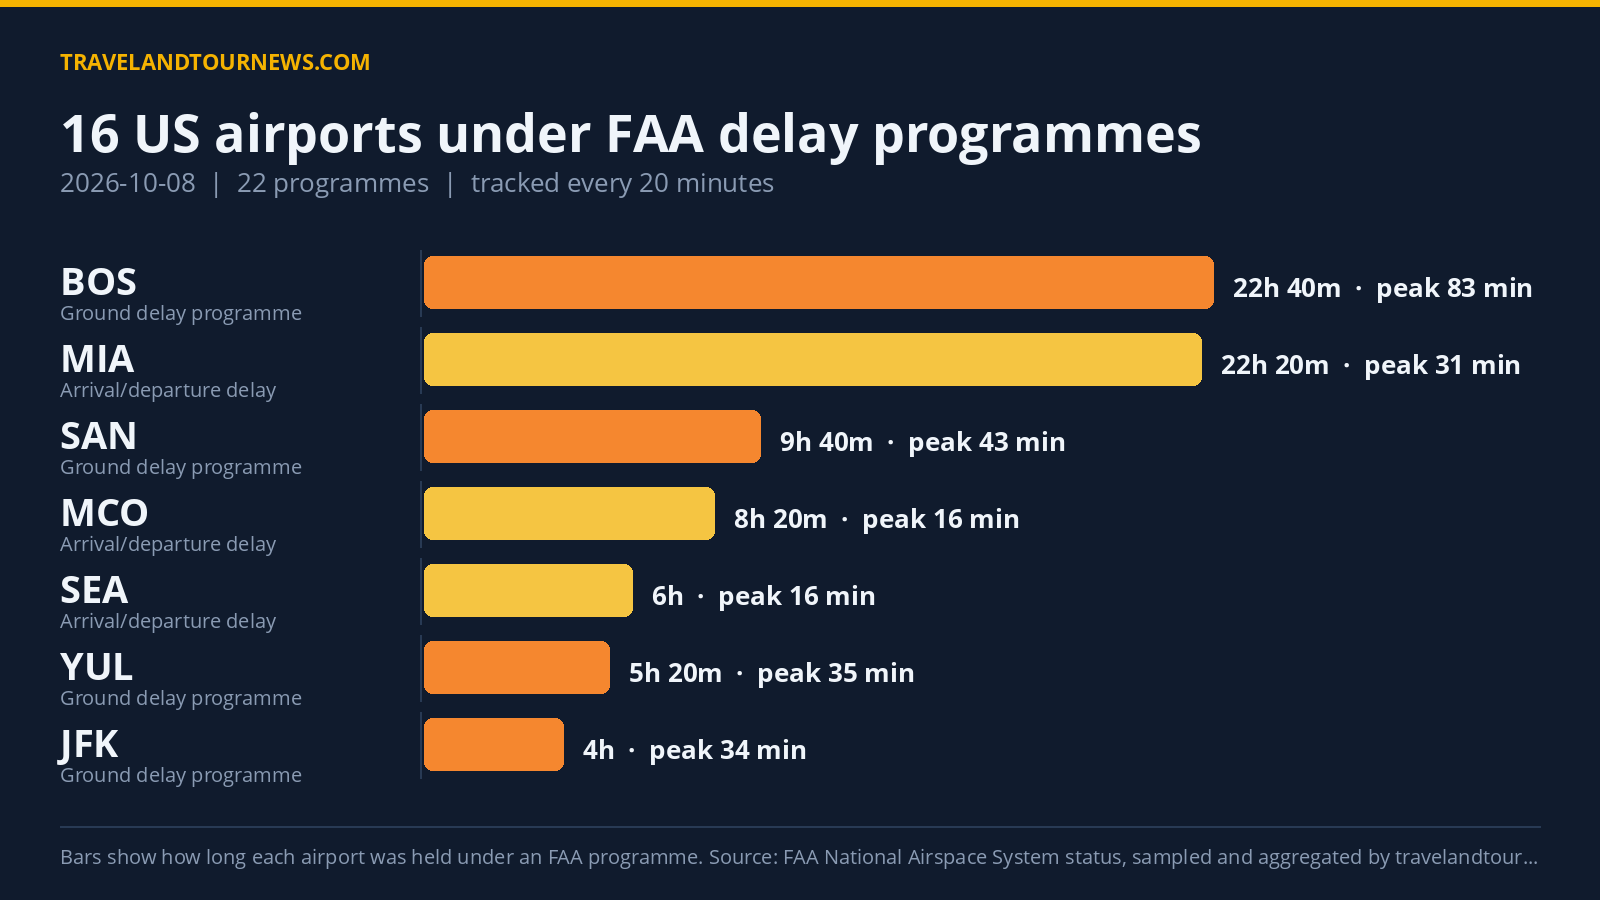

On October 8, 2026, the FAA held 16 U.S. airports under 22 delay programs, with Boston Logan International (BOS) experiencing the worst peak delay of 186 minutes during a prolonged ground delay program.
Delay Programs at 16 Airports and Peak Delay Figures
Delay programs affected airports ranging across the United States and Canada, including AUS, BOS, DAL, FLL, JFK, LAS, MCO, MIA, OPF, ORD, SAN, SEA, TEB, TPA, YUL, and YYC. Programs were categorized into three types: five ground stop programs that hold departures at their origin, seven ground delay programs that meter arrivals through later departure assignments, and ten general arrival/departure delay advisories.
Ground stop programs were active at TEB, SEA, AUS, YUL, and JFK, ranging from 20 minutes to one hour. Notably, the Teterboro Airport (TEB) ground stop lasted 1 hour due to wind but reported no average or maximum
delay minutes.
Ground delay programs were longest at Boston Logan, in force for 22 hours and 40 minutes from midnight to 22:40 UTC, with a peak average delay of 83 minutes and a peak maximum delay of 186 minutes caused by runway construction. Other airports with ground delay programs included Seattle-Tacoma (80 minutes, peak average 50 minutes), San Diego (9 hours 40 minutes, peak average 43 minutes), Austin (1 hour 20 minutes, peak average 43 minutes), Montreal-Trudeau (5 hours 20 minutes, peak average 35 minutes), JFK (4 hours, peak average 34 minutes), and Calgary (1 hour 20 minutes, peak average
32 minutes).
General arrival/departure delay information was issued at 10 airports for durations ranging from 20 minutes up to 22 hours 20 minutes, with peak average delays typically around 16 to 31 minutes.
| Airport | FAA programme | Cause | Peak average delay | In force (UTC) |
|---|---|---|---|---|
| TEB | Ground Stop Programs | wind | – | 18:40 to 19:40 (1 hour) |
| Seattle-Tacoma International (SEA) | Ground Stop Programs | low visibility | – | 15:20 to 15:20 (20 minutes) |
| AUS | Ground Stop Programs | runway construction | – | 19:20 to 19:40 (20 minutes) |
| YUL | Ground Stop Programs | runway construction | – | 19:40 to 19:40 (20 minutes) |
| John F. Kennedy International (JFK) | Ground Stop Programs | wind | – | 22:20 to 22:40 (20 minutes) |
| Boston Logan International (BOS) | Ground Delay Programs | runway construction | 83 min | 00:00 to 22:40 (22 hours 40 minutes) |
| Seattle-Tacoma International (SEA) | Ground Delay Programs | low visibility | 50 min | 15:40 to 17:00 (1 hour 20 minutes) |
| San Diego International (SAN) | Ground Delay Programs | low ceilings; LOW | 43 min | 13:00 to 22:40 (9 hours 40 minutes) |
| AUS | Ground Delay Programs | runway construction | 43 min | 20:00 to 21:20 (1 hour 20 minutes) |
| YUL | Ground Delay Programs | other; runway construction | 35 min | 17:20 to 22:40 (5 hours 20 minutes) |
| John F. Kennedy International (JFK) | Ground Delay Programs | wind | 34 min | 18:40 to 22:40 (4 hours) |
| YYC | Ground Delay Programs | runway construction | 32 min | 21:20 to 22:40 (1 hour 20 minutes) |
| Miami International (MIA) | General Arrival/Departure Delay Info | TM Initiatives:MIT:WX | 31 min | 00:00 to 22:20 (22 hours 20 minutes) |
| TEB | General Arrival/Departure Delay Info | WX:Wind | 31 min | 18:40 to 21:20 (2 hours 40 minutes) |
Runway Construction and Weather Drove Most Delay Programs
The primary reason behind the largest number of delay programs was runway construction, cited in 53 samples across airports including Boston Logan, Austin, Montreal, and Seattle. Weather conditions also factored significantly; low ceilings caused delays at San Diego and other airports in 20 samples, while wind-related disruptions accounted for 17 samples. Traffic management initiatives related to weather (TM Initiatives:MIT:WX) featured in 19 sampled programs, and multi-taxi volume
(VOL:Multi-taxi) affected 12 samples, mainly at Chicago O’Hare.
Comparing October 8 to Recent Delay Trends
Delay activity on October 8 rose compared to the previous day, with five more airports affected than yesterday’s total of 11, and the number of delay programs increased by eight from 14 to 22. The seven-day average for airports affected stands at 13.6, slightly lower than today’s 16. This day does not represent the highest disruption level recorded in the recent tracking period.
Methodology. travelandtournews.com samples the FAA’s National Airspace System status feed every 20 minutes throughout the US operating day and aggregates the result. This report is built from 66 samples
taken between 00:00 and 22:40 UTC on 2026-10-08. Durations are the observed window between the first and last sample in which a programme was in force, so a programme’s true length may be slightly longer than shown. Ground stops, ground delay programmes, airport closures and general delays are all published by the FAA in real time; the daily aggregation is ours.