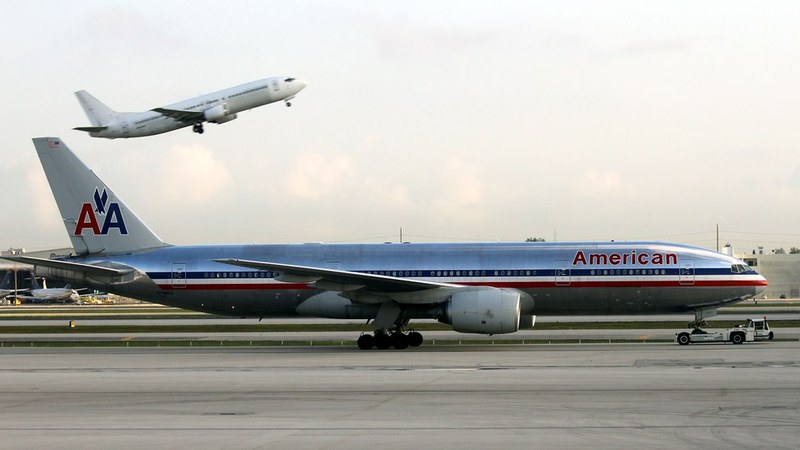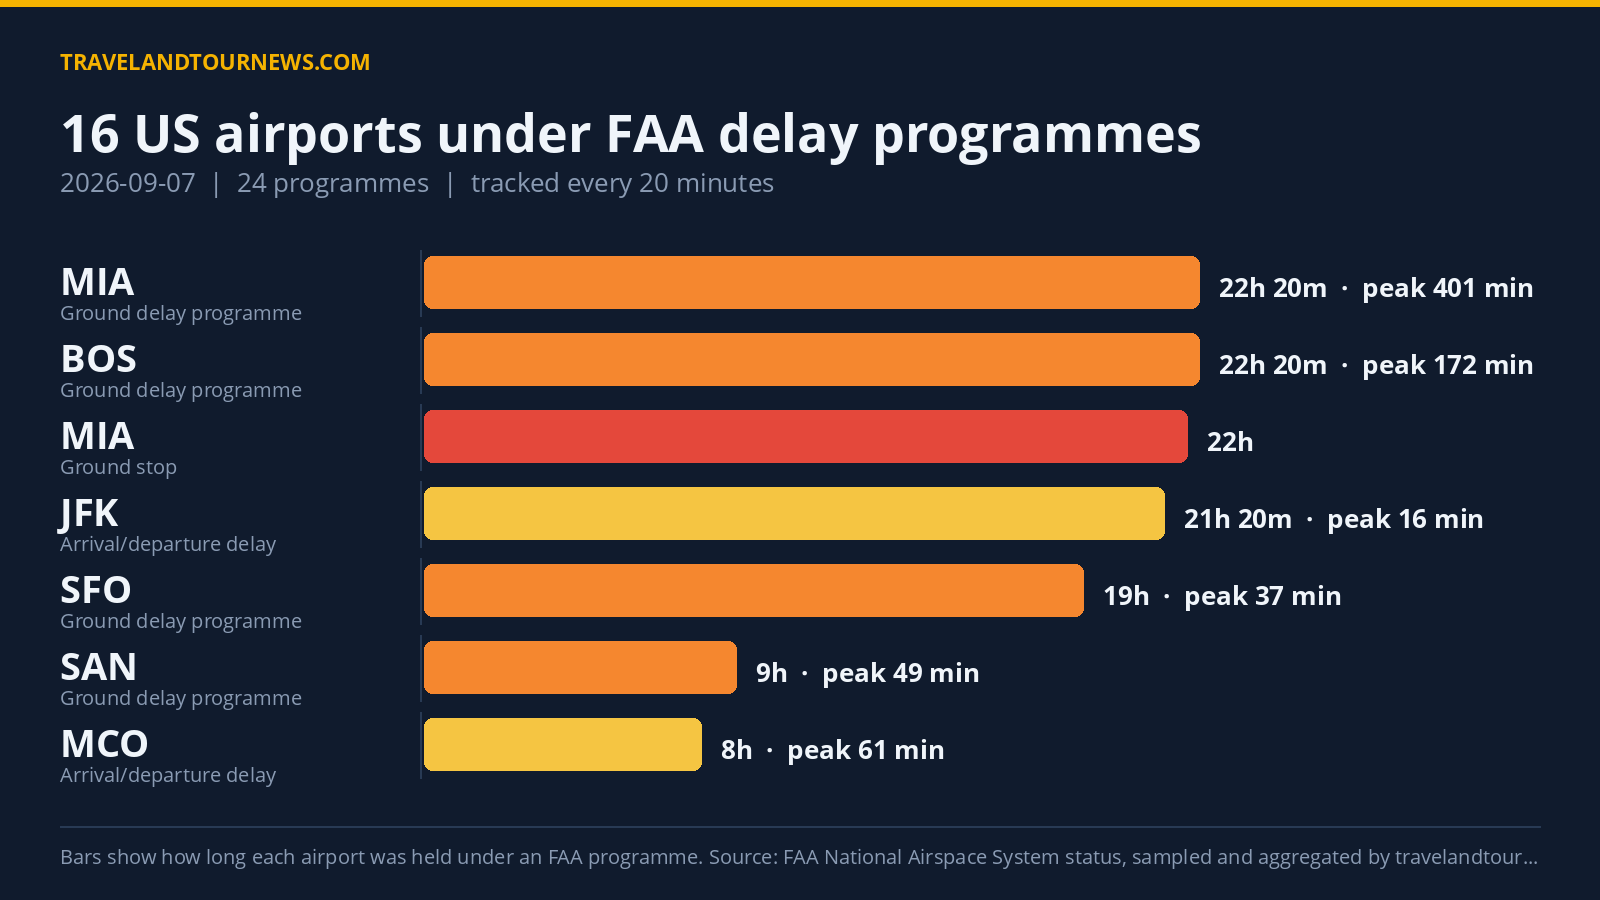

On September 7, 2026, the FAA held delay programmes at 16 airports across the United States, applying a total of 24 distinct programmes throughout the day. Miami International Airport (MIA) was the worst affected, with a peak delay of 1137 minutes amid ground stop and ground delay programmes caused by thunderstorms and a disabled aircraft on the runway.
Airports Under Delay Programmes and Their Impact
Delay programmes in the United States ran between midnight and late evening, with the longest programme lasting 1340 minutes, roughly 22 hours 20 minutes. These programmes included 6 ground stop programmes, which hold departures at their origin airports to manage arrival traffic, and 8 ground delay programmes, which meter arrivals by assigning later departure times. The remaining 10 programmes provided general arrival and departure delay information.
Miami International (MIA) experienced two concurrent programmes: a ground stop and a ground delay programme, both caused by thunderstorms and a disabled aircraft blocking the runway. These programmes were observed in 47 samples between
00:00 and 22:20 UTC, with the ground delay programme peaking at an average arrival delay of 401 minutes and a maximum delay of 1137 minutes.
Other airports with ground stop programmes included Teterboro (TEB), which had a programme due to airport volume lasting 1 hour 40 minutes between 19:00 and 20:40 UTC; Orlando International (MCO) and Denver International (DEN), which had short ground stops due to thunderstorms; Chicago O’Hare (ORD) with a 20-minute ground stop attributable to staffing; and Westchester County (HPN) with a brief volume-related ground stop. None of these ground stop programmes showed recorded peak delays but contributed
to managing arrivals.
Several airports operated ground delay programmes driven mostly by airport volume and construction. Boston Logan (BOS) and San Francisco International (SFO) had long-lasting ground delay programmes over roughly 22 and 19 hours respectively, with BOS reporting peak average delays of 172 minutes and a peak max delay of 434 minutes due to a mix of runway construction and other causes. SFO’s ground delay programme listed runway construction and unspecified other reasons. San Diego (SAN) ran a 9-hour ground delay programme related to airport volume, with peak average delays near 49 minutes. Smaller ground delay programmes at Teterboro,
Westchester County, Chicago O’Hare, and Toronto (YYZ) also cited airport volume or other causes, with peak delays ranging from 25 to 150 minutes.
| Airport | FAA programme | Cause | Peak average delay | In force (UTC) |
|---|---|---|---|---|
| Miami International (MIA) | Ground Stop Programs | disabled aircraft on the runway; thunderstorms | – | 00:00 to 22:00 (22 hours) |
| TEB | Ground Stop Programs | airport volume | – | 19:00 to 20:40 (1 hour 40 minutes) |
| Orlando International (MCO) | Ground Stop Programs | thunderstorms | – | 21:00 to 22:20 (1 hour 20 minutes) |
| Denver International (DEN) | Ground Stop Programs | thunderstorms | – | 00:00 to 00:40 (40 minutes) |
| Chicago O’Hare International (ORD) | Ground Stop Programs | STAFFING | – | 00:40 to 00:40 (20 minutes) |
| HPN | Ground Stop Programs | airport volume | – | 19:20 to 19:40 (20 minutes) |
| Miami International (MIA) | Ground Delay Programs | disabled aircraft on the runway; thunderstorms | 401 min | 00:00 to 22:20 (22 hours 20 minutes) |
| Boston Logan International (BOS) | Ground Delay Programs | other; runway construction | 172 min | 00:00 to 22:20 (22 hours 20 minutes) |
| TEB | Ground Delay Programs | airport volume | 150 min | 21:20 to 22:20 (1 hour) |
| HPN | Ground Delay Programs | airport volume | 84 min | 20:00 to 22:00 (2 hours) |
| San Diego International (SAN) | Ground Delay Programs | airport volume | 49 min | 13:20 to 22:20 (9 hours) |
| San Francisco International (SFO) | Ground Delay Programs | other; runway construction | 37 min | 00:00 to 19:00 (19 hours) |
| YYZ | Ground Delay Programs | airport volume | 26 min | 19:00 to 19:40 (40 minutes) |
| Chicago O’Hare International (ORD) | Ground Delay Programs | other | 25 min | 00:00 to 00:40 (40 minutes) |
Top Causes of Delay Programmes
The most cited cause of delay programmes on September 7 was disabled aircraft on the runway, reported 39 times across the dataset. This was closely followed by airport volume, cited 37 times, and a variety of other reasons noted 20 times. Runway construction was implicated in 17 programmes, and thunderstorms appeared as causes in 16.
Miami’s extensive delays were linked primarily to a disabled aircraft on the runway combined with thunderstorms. Volume-driven delays affected multiple ground delay
programmes at airports such as SAN, TEB, and HPN. Runway construction influenced long-running ground delay programmes at BOS and SFO.
Comparison to Previous Days
Compared to September 6, 2026, when 17 airports were affected and 20 programmes ran, September 7 showed a slight decrease to 16 affected airports and 24 programmes total. The change versus the previous day was minus one airport, while programme count increased by four. The seven-day average before September 7 registered around 18.9 airports affected, positioning this day slightly below the weekly average in terms of impacted airports but above average in programmes.
Methodology. travelandtournews.com samples the FAA’s National Airspace
System status feed every 20 minutes throughout the US operating day and aggregates the result. This report is built from 55 samples taken between 00:00 and 22:20 UTC on 2026-09-07. Durations are the observed window between the first and last sample in which a programme was in force, so a programme’s true length may be slightly longer than shown. Ground stops, ground delay programmes, airport closures and general delays are all published by the FAA in real time; the daily aggregation is ours.