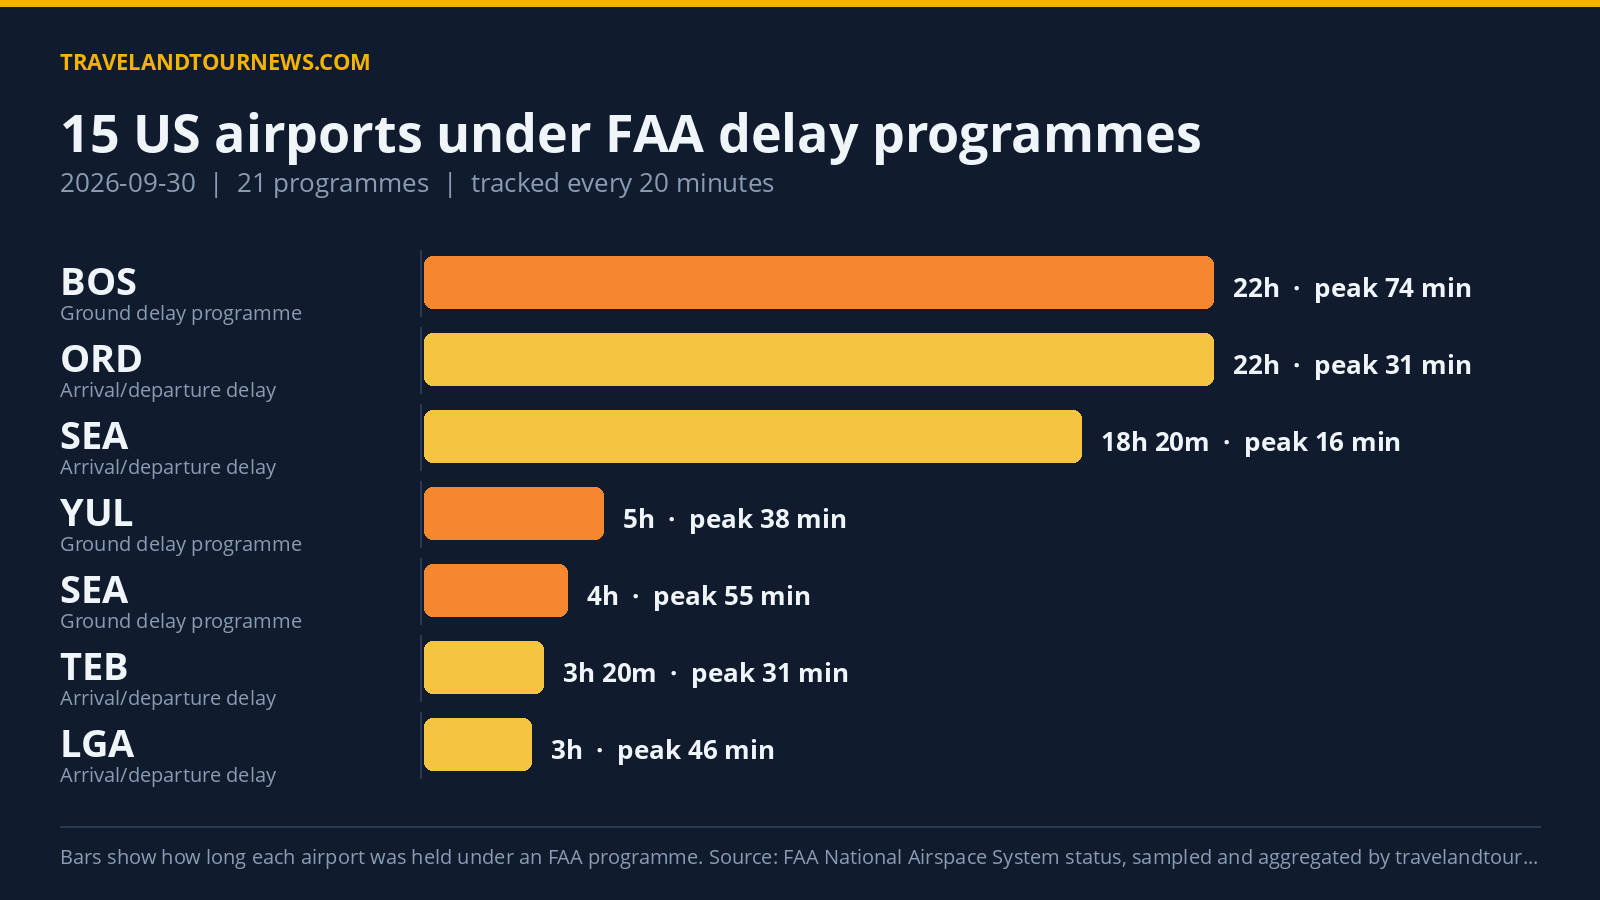

On September 30, 2026, the FAA enforced delay programs across 15 United States airports, applying a total of 21 programs. Austin-Bergstrom International (AUS) was the worst-affected airport, enduring a ground stop program for 2 hours and 40 minutes due to a disabled aircraft on the runway and high airport volume.
Delay programs included four Ground Stop Programs, which hold departures bound for an airport on the ground at their origin, and five Ground Delay Programs, which meter arrivals by assigning later departure times. The remaining 12 programs provided general arrival/departure delay information.
Delay Programs by Airport and Duration
AUS experienced a ground stop program from 16:40 to 19:20 UTC with no recorded peak delay minutes but was observed for 160 minutes. Dallas/Fort Worth International (DFW) had a ground stop program of 40 minutes from 20:00 to 20:40 UTC due to thunderstorms and an additional ground delay program lasting one hour from 21:00 to 22:00 UTC with
peak average delays of 48 minutes and maximum delays of 162 minutes. Dallas Love Field (DAL) had a ground stop from 21:20 to 22:00 UTC and a general delay program shortly before.
Other ground stop programs included Newark Liberty International (EWR) for 20 minutes and Dallas Love Field (DAL) again for 40 minutes caused by thunderstorms. Boston Logan International (BOS) had the longest ground delay program of 22 hours due to runway construction, with peak average delay reaching 74 minutes and a maximum delay of 306 minutes.
Seattle-Tacoma International (SEA) ran a four-hour ground delay program for low ceilings and
an extended arrival/departure delay program lasting over 18 hours. YUL had a five-hour ground delay program due to runway construction. San Diego International (SAN) faced two programs related to airport volume and compacted demand lasting over two hours each.
General arrival and departure delay information covered airports such as LaGuardia (LGA), Chicago O’Hare International (ORD), Teterboro (TEB), Phoenix Sky Harbor International (PHX), John F. Kennedy International (JFK), and Hartsfield-Jackson Atlanta International (ATL) with diverse causes and durations.
| Airport | FAA programme | Cause | Peak average delay | In force (UTC) |
|---|---|---|---|---|
| AUS | Ground Stop Programs | disabled aircraft on the runway; airport volume | – | 16:40 to 19:20 (2 hours 40 minutes) |
| Dallas/Fort Worth International (DFW) | Ground Stop Programs | THUNDERSTORMS; thunderstorms | – | 20:00 to 20:40 (40 minutes) |
| Dallas Love Field (DAL) | Ground Stop Programs | thunderstorms | – | 21:20 to 22:00 (40 minutes) |
| Newark Liberty International (EWR) | Ground Stop Programs | airspace volume | – | 21:40 to 21:40 (20 minutes) |
| Boston Logan International (BOS) | Ground Delay Programs | runway construction | 74 min | 00:00 to 22:00 (22 hours) |
| Seattle-Tacoma International (SEA) | Ground Delay Programs | low ceilings | 55 min | 00:20 to 04:20 (4 hours) |
| Dallas/Fort Worth International (DFW) | Ground Delay Programs | thunderstorms | 48 min | 21:00 to 22:00 (1 hour) |
| YUL | Ground Delay Programs | runway construction | 38 min | 17:00 to 22:00 (5 hours) |
| San Diego International (SAN) | Ground Delay Programs | airport volume | 22 min | 00:00 to 02:20 (2 hours 20 minutes) |
| Dallas/Fort Worth International (DFW) | General Arrival/Departure Delay Info | WX:Thunderstorms | 61 min | 20:20 to 22:00 (1 hour 40 minutes) |
| DJT | General Arrival/Departure Delay Info | WX:Thunderstorms | 61 min | 19:40 to 20:40 (1 hour) |
| LaGuardia (LGA) | General Arrival/Departure Delay Info | EQ:FAA; RWY:Rwy Change – Operational Advantage | 46 min | 16:20 to 19:20 (3 hours) |
| Chicago O’Hare International (ORD) | General Arrival/Departure Delay Info | RWY:Obstruction; WX:Low Ceilings | 31 min | 00:00 to 22:00 (22 hours) |
| TEB | General Arrival/Departure Delay Info | RWY:Maintenance; VOL:Volume | 31 min | 15:40 to 19:00 (3 hours 20 minutes) |
Runway Construction and Obstructions Led Delay Causes
The most frequent cause for delay programs was runway construction, cited 43 times, primarily affecting airports like Boston Logan and YUL. Runway obstruction
was the second-leading cause with 17 occurrences, impacting Chicago O’Hare and other airports. Low ceilings and thunderstorms each caused 13 programs, affecting Seattle, Dallas, and other hubs.
Airport volume contributed to 10 delay programs, including at AUS and SAN. Other specific reasons cited included disabled aircraft on the runway, airspace volume, runway maintenance, low visibility, and traffic metering initiatives.
Compared to Yesterday and Recent Average
Compared with the previous day, September 29, 2026, the number of airports affected rose from 10 to 15, and total delay programs climbed from 15 to 21, an increase of five programs. Against a seven-day average of 14.6 airports affected, today’s
figure is slightly above average but not the highest in our tracking window.
Methodology. travelandtournews.com samples the FAA’s National Airspace System status feed every 20 minutes throughout the US operating day and aggregates the result. This report is built from 66 samples taken between 00:00 and 22:00 UTC on 2026-09-30. Durations are the observed window between the first and last sample in which a programme was in force, so a programme’s true length may be slightly longer than shown. Ground stops, ground delay programmes, airport closures and general delays are all published by the FAA in real time; the daily
aggregation is ours.