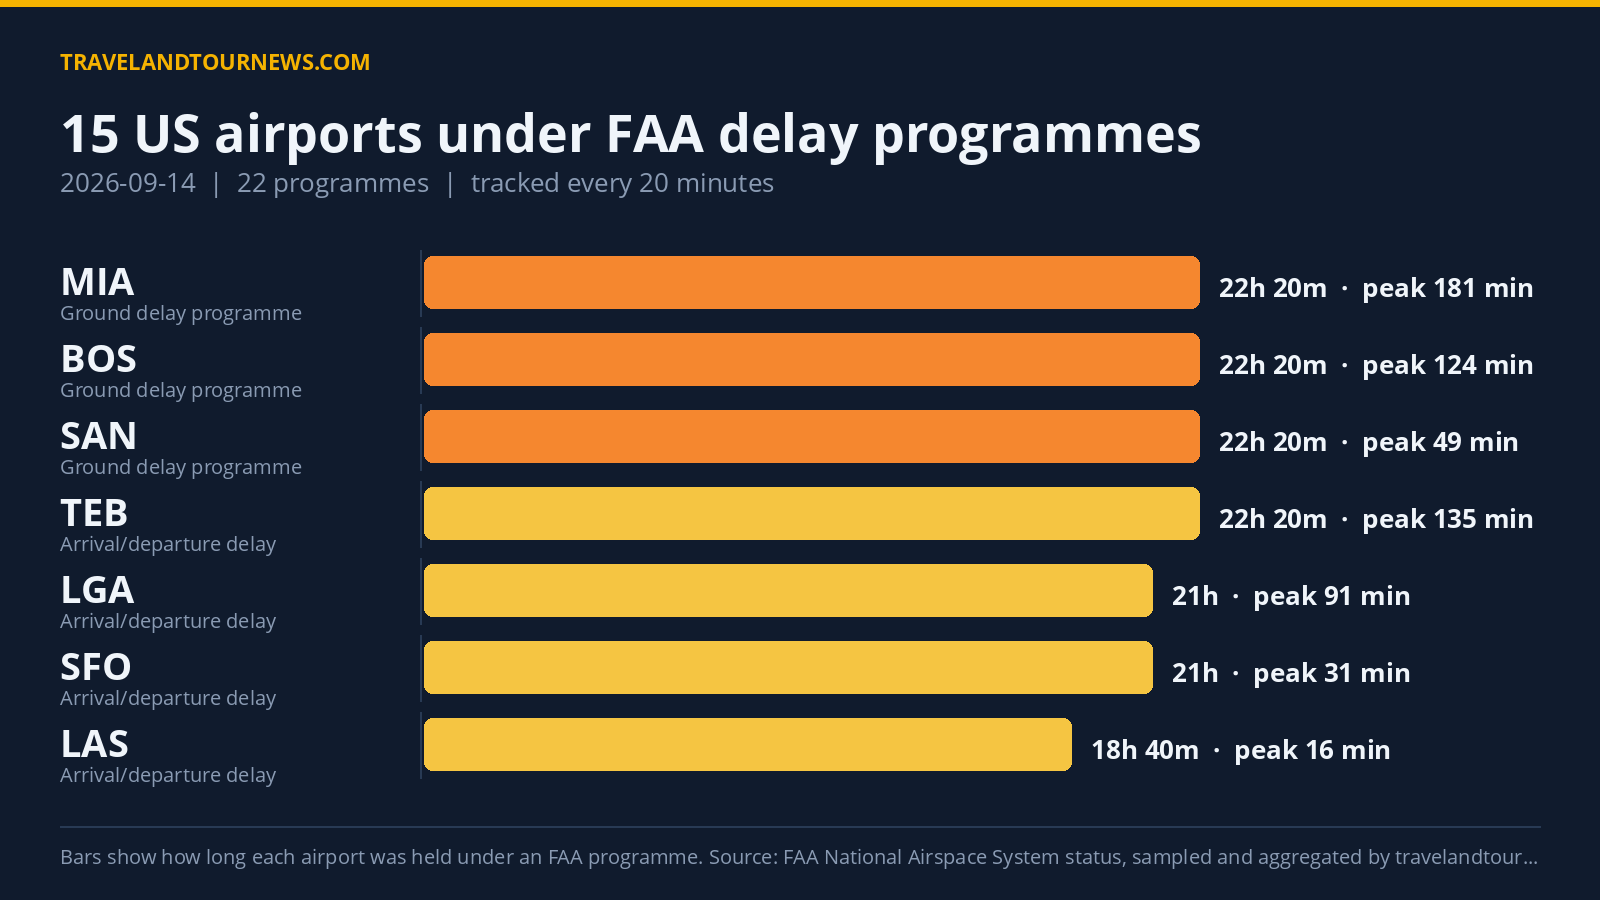

On September 14, 2026, the FAA implemented delay programmes affecting 15 airports across the United States. A total of 22 programmes were active throughout the day, with Teterboro Airport (TEB) reported as the worst hit airport. Although TEB recorded no delays in minutes, it experienced a ground stop programme triggered by thunderstorms lasting 40 minutes.
Airports and Delay Programmes Throughout the Day
Fifteen airports were under FAA delay programmes of varying types. These included 5 Ground Stop Programmes, which hold departures bound for the airport on the ground at their origin, 4 Ground Delay Programmes, which meter arrivals by assigning later departure times, 1 Airport Closure, and 12 General Arrival/Departure Delay Info notices.
Ground Stop Programmes due to thunderstorms affected TEB, John F. Kennedy International (JFK), LaGuardia (LGA), Newark Liberty International (EWR), and Orlando International (MCO). Most lasted 40 minutes, except the one at MCO which was observed for 20 minutes. None recorded delays in minutes.
Ground Delay Programmes were observed at
Miami International (MIA) for 22 hours 20 minutes due to a disabled aircraft on the runway, where peak average delay reached 181 minutes and peak maximum delay was 472 minutes. Boston Logan International (BOS) and Seattle-Tacoma International (SEA) both had ground delays due to runway construction lasting 22 hours 20 minutes and 4 hours 20 minutes respectively, with BOS peak average delays of 124 minutes and SEA 28 minutes. San Diego International (SAN) had a ground delay lasting 22 hours 20 minutes due to airport volume, with peak average delay at 49 minutes.
San Diego International was also the only
airport to experience an airport closure lasting 4 hours 20 minutes.
The longest single programme observed was the disabled aircraft incident at MIA, lasting 1340 minutes (22 hours 20 minutes). The highest peak average delay across all programmes was 181 minutes at MIA, with the maximum peak delay at 472 minutes.
| Airport | FAA programme | Cause | Peak average delay | In force (UTC) |
|---|---|---|---|---|
| TEB | Ground Stop Programs | thunderstorms | – | 00:00 to 00:40 (40 minutes) |
| John F. Kennedy International (JFK) | Ground Stop Programs | thunderstorms | – | 00:00 to 00:40 (40 minutes) |
| LaGuardia (LGA) | Ground Stop Programs | thunderstorms | – | 00:00 to 00:40 (40 minutes) |
| Newark Liberty International (EWR) | Ground Stop Programs | thunderstorms | – | 00:00 to 00:40 (40 minutes) |
| Orlando International (MCO) | Ground Stop Programs | thunderstorms | – | 22:20 to 22:20 (20 minutes) |
| Miami International (MIA) | Ground Delay Programs | disabled aircraft on the runway | 181 min | 00:00 to 22:20 (22 hours 20 minutes) |
| Boston Logan International (BOS) | Ground Delay Programs | runway construction | 124 min | 00:00 to 22:20 (22 hours 20 minutes) |
| San Diego International (SAN) | Ground Delay Programs | airport volume | 49 min | 00:00 to 22:20 (22 hours 20 minutes) |
| Seattle-Tacoma International (SEA) | Ground Delay Programs | runway construction | 28 min | 00:00 to 04:20 (4 hours 20 minutes) |
| San Diego International (SAN) | Airport Closures | airport closed | – | 08:20 to 12:40 (4 hours 20 minutes) |
| TEB | General Arrival/Departure Delay Info | ZDC / TM Initiatives:MIT:VOL; TM Initiatives:SWAP:WX; RWY:Maintenance | 135 min | 00:00 to 22:20 (22 hours 20 minutes) |
| LaGuardia (LGA) | General Arrival/Departure Delay Info | TM Initiatives:SWAP:WX; WX:Wind | 91 min | 00:00 to 21:00 (21 hours) |
| Newark Liberty International (EWR) | General Arrival/Departure Delay Info | TM Initiatives:SWAP:WX | 46 min | 00:00 to 04:00 (4 hours) |
| Ronald Reagan Washington National (DCA) | General Arrival/Departure Delay Info | TM Initiatives:SWAP:WX | 46 min | 00:00 to 02:20 (2 hours 20 minutes) |
Top Causes of FAA Delay Programmes
The top causes behind these FAA delay programmes reflect specific operational and weather-related challenges. TM Initiatives:SWAP:WX was the leading cause, involved in 41 recorded instances. Runway construction was the close second cause with 39 instances, while airport volume contributed to 27 programmes. Disabled aircraft on the runway accounted for
18 programmes, mainly at Miami International. RWY:Construction was listed as a cause in 15 programmes, cited separately from general runway construction.
Thunderstorms directly caused all the ground stops at TEB, JFK, LGA, EWR, and MCO.
Comparison to Previous Days and Recent Trends
Compared to the previous day, when 19 airports were affected by 28 programmes, the September 14 figures represent a decrease of 4 programmes and 4 fewer airports affected. Against the recent seven-day average of 14.7 airports affected daily, target day impact was slightly above average at 15 airports.
This day was not the worst in the recent tracking window, indicating moderate operational conditions relative to
recent days.
Methodology. travelandtournews.com samples the FAA’s National Airspace System status feed every 20 minutes throughout the US operating day and aggregates the result. This report is built from 56 samples taken between 00:00 and 22:20 UTC on 2026-09-14. Durations are the observed window between the first and last sample in which a programme was in force, so a programme’s true length may be slightly longer than shown. Ground stops, ground delay programmes, airport closures and general delays are all published by the FAA in real time; the daily aggregation is ours.