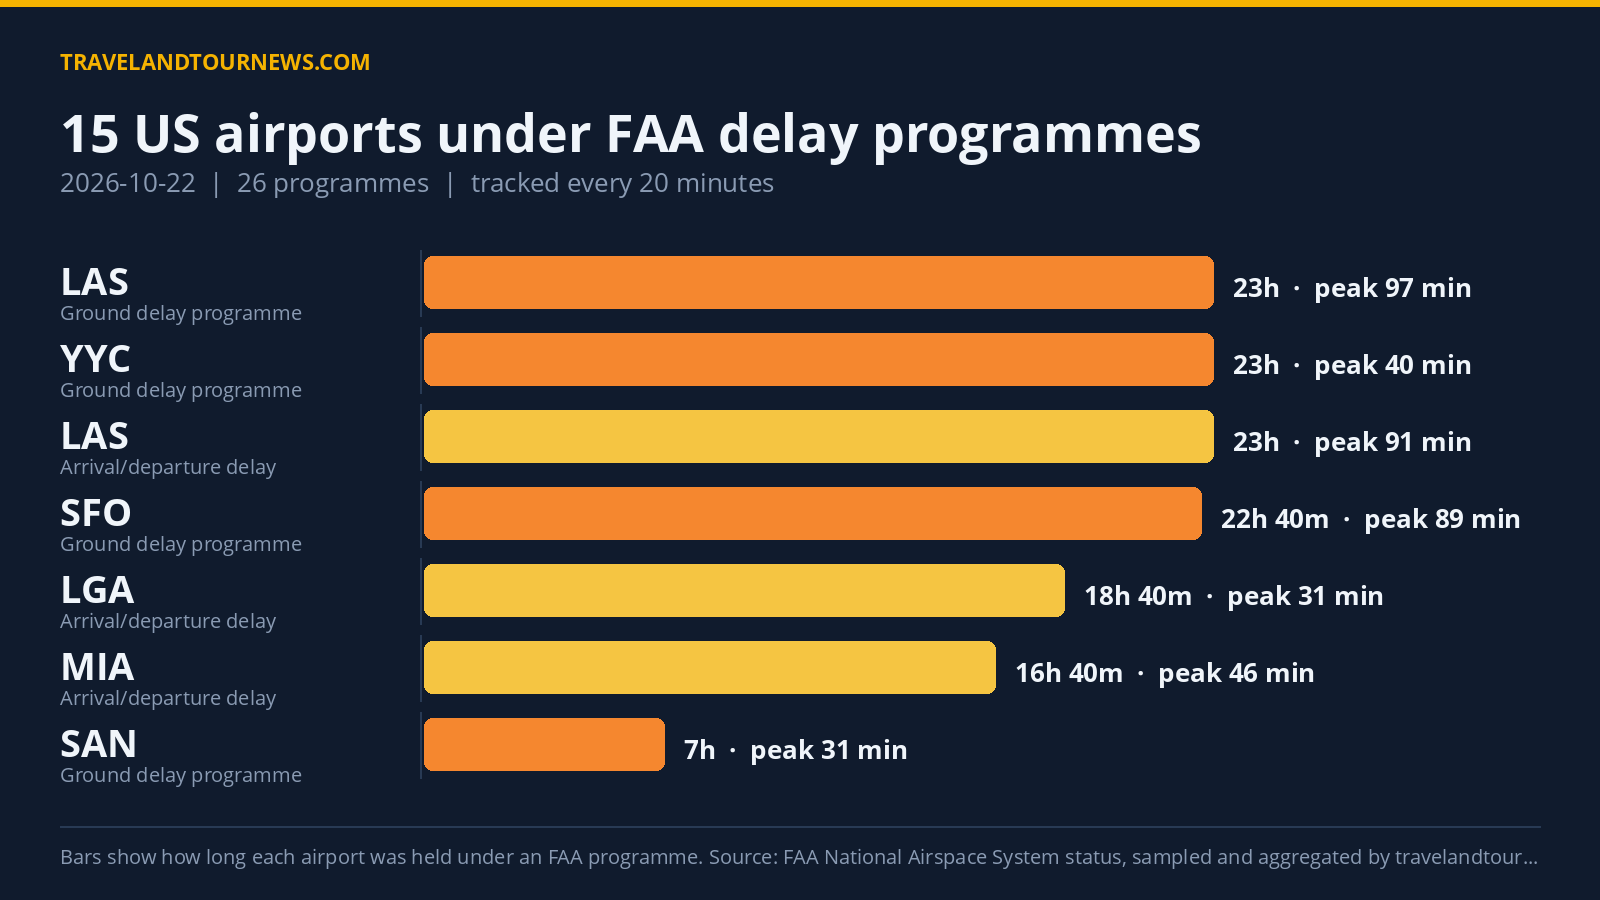


On October 22, 2026, the FAA held 14 airports in the United States under 22 delay programs, including ground stops, ground delays, and general arrival/departure delay updates. The most affected airport was Harry Reid International (LAS), where peak delays reached 570 minutes in a ground delay program caused by rain and other factors.
Airports and Duration of Delay Programs
Fourteen airports experienced delays under three FAA program types: 5 ground stop programs, which hold departures bound for an airport on the ground at their origin; 8 ground delay programs, which meter arrivals by assigning later departure times; and 9 general arrival/departure delay info updates. Ground stop programs were notably in effect at Boston Logan International (BOS) for 1 hour due to runway construction, LaGuardia (LGA) for 40 minutes due to airport volume, Harry Reid International (LAS) for 20 minutes due to rain, Ronald Reagan Washington National (DCA) for 20 minutes due to equipment outage, and Denver International (DEN) for
20 minutes also due to runway construction.
Ground delay programs extended much longer, with LAS’s program active for 22 hours, producing a peak average delay of 97 minutes and a maximum delay of 570 minutes. San Francisco International (SFO) had a nearly full-day ground delay program lasting 21 hours and 40 minutes due to low ceilings, with peak average delay at 89 minutes. Boston Logan experienced a 2-hour ground delay program linked to runway construction, with a peak average delay of 55 minutes. Calgary (YYC) maintained a 22-hour ground delay for runway construction with a 40-minute peak average delay. Other
significant ground delays occurred at Phoenix Sky Harbor (PHX), Austin (AUS), San Diego (SAN), and Montreal (YUL) with durations ranging from 5 to 6 hours and delays from 14 to 40 minutes on average. General arrival/departure delay info programs were spread widely with delays driven by equipment issues, staffing, runway obstructions, and traffic management initiatives.
| Airport | FAA programme | Cause | Peak average delay | In force (UTC) |
|---|---|---|---|---|
| Boston Logan International (BOS) | Ground Stop Programs | runway construction | – | 00:00 to 01:00 (1 hour) |
| LaGuardia (LGA) | Ground Stop Programs | airport volume | – | 17:20 to 18:00 (40 minutes) |
| Harry Reid International (LAS) | Ground Stop Programs | rain | – | 19:00 to 19:20 (20 minutes) |
| Ronald Reagan Washington National (DCA) | Ground Stop Programs | equipment outage | – | 21:20 to 21:40 (20 minutes) |
| Denver International (DEN) | Ground Stop Programs | runway construction | – | 21:40 to 22:00 (20 minutes) |
| Harry Reid International (LAS) | Ground Delay Programs | other; rain | 97 min | 00:00 to 22:00 (22 hours) |
| San Francisco International (SFO) | Ground Delay Programs | low ceilings | 89 min | 00:20 to 22:00 (21 hours 40 minutes) |
| Boston Logan International (BOS) | Ground Delay Programs | runway construction | 55 min | 00:00 to 02:00 (2 hours) |
| YYC | Ground Delay Programs | runway construction | 40 min | 00:00 to 22:00 (22 hours) |
| Phoenix Sky Harbor International (PHX) | Ground Delay Programs | thunderstorms | 40 min | 16:00 to 18:00 (2 hours) |
| AUS | Ground Delay Programs | runway construction | 35 min | 17:00 to 22:00 (5 hours) |
| San Diego International (SAN) | Ground Delay Programs | airport volume | 31 min | 16:00 to 22:00 (6 hours) |
| YUL | Ground Delay Programs | runway construction | 14 min | 17:00 to 22:00 (5 hours) |
| Ronald Reagan Washington National (DCA) | General Arrival/Departure Delay Info | EQ:OCL: Equipment | 91 min | 20:00 to 22:00 (2 hours) |
Delay Causes Grouped by Frequency
Runway construction was the dominant cause, associated with 61 sampled delay programs across airports including BOS, DEN, YYC, AUS, and YUL. Low ceilings caused 23 collected samples of delay programs, primarily at SFO. Airport volume constraints generated 22 delay instances notably at SAN and LGA.
Staffing shortages contributed 16 delay records mostly at LAS. Additional causes included equipment outages, rain, thunderstorms, and various FAA traffic management initiatives. Rain was specifically notable at LAS, identified in both ground stop and ground delay programs.
Comparison With Recent Average
The 14 airports affected on October 22 slightly underperformed the recent seven-day average of 15.1 airports under delay programs across the United States. This day was not the worst in the tracking window. The FAA’s delay environment on October 22 remained close to typical levels seen over the past week.
Methodology. travelandtournews.com samples the FAA’s National Airspace System status feed every 20 minutes
throughout the US operating day and aggregates the result. This report is built from 56 samples taken between 00:00 and 22:00 UTC on 2026-10-22. Durations are the observed window between the first and last sample in which a programme was in force, so a programme’s true length may be slightly longer than shown. Ground stops, ground delay programmes, airport closures and general delays are all published by the FAA in real time; the daily aggregation is ours.