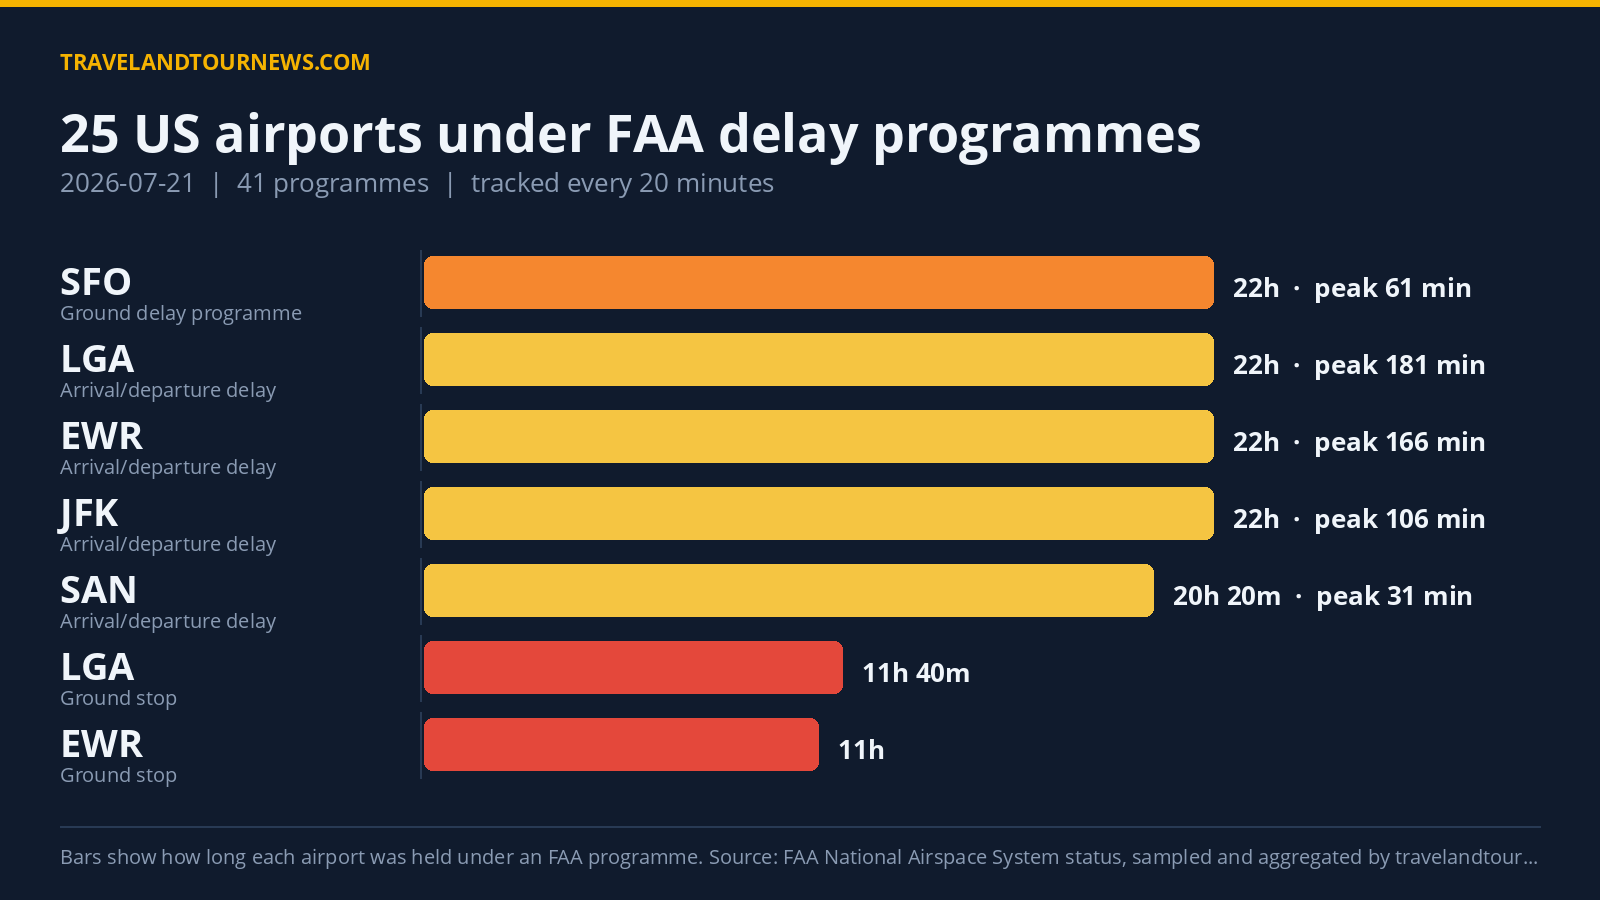

On July 21, 2026, the FAA held 25 U.S. airports under a total of 41 delay programmes, with LaGuardia Airport (LGA) the worst-affected. LGA experienced the longest ground stop programme due to thunderstorms, lasting 11 hours and 40 minutes, marking a significant disruption in the United States airspace.
Delays at 25 Airports Managed Through Multiple Programme Types
The 41 programmes recorded in the United States on July 21 fall into three main types: 18 Ground Stop Programmes, where aircraft departures bound for an airport were held on the ground at their origin; 7 Ground Delay Programmes, which meter arrivals by assigning later departure times; and 16 General Arrival/Departure Delay Informations, indicating broader delay conditions.
The longest single programme was a Ground Stop at LaGuardia (LGA), active from 10:20 to 22:00 UTC, observed over 700 minutes. Newark Liberty International (EWR) and Teterboro (TEB) airports also saw extended ground stops lasting 11 hours and 9 hours 40 minutes respectively.
Boston Logan International (BOS), John F. Kennedy International (JFK), Ronald Reagan Washington National (DCA), and Philadelphia International (PHL) all had ground stops exceeding four hours.
Peak maximum delay minutes varied across airports, with Newark recording a maximum delay of 665 minutes during its Ground Delay Programme. JFK’s Ground Delay Programme saw peak average delays of 232 minutes and maximum delays up to 562 minutes. LaGuardia’s Ground Delay Programme peaked at an average delay of 217 minutes and a maximum of 365 minutes.
| Airport | FAA programme | Cause | Peak average delay | In force (UTC) |
|---|---|---|---|---|
| LaGuardia (LGA) | Ground Stop Programs | thunderstorms | – | 10:20 to 22:00 (11 hours 40 minutes) |
| Newark Liberty International (EWR) | Ground Stop Programs | thunderstorms | – | 11:00 to 22:00 (11 hours) |
| TEB | Ground Stop Programs | thunderstorms | – | 12:20 to 22:00 (9 hours 40 minutes) |
| HPN | Ground Stop Programs | thunderstorms | – | 14:20 to 21:40 (7 hours 20 minutes) |
| Boston Logan International (BOS) | Ground Stop Programs | thunderstorms | – | 15:40 to 22:00 (6 hours 20 minutes) |
| John F. Kennedy International (JFK) | Ground Stop Programs | thunderstorms | – | 13:20 to 19:00 (5 hours 40 minutes) |
| Ronald Reagan Washington National (DCA) | Ground Stop Programs | thunderstorms | – | 16:20 to 22:00 (5 hours 40 minutes) |
| Washington Dulles International (IAD) | Ground Stop Programs | thunderstorms; THUNDERSTORMS | – | 17:40 to 22:00 (4 hours 20 minutes) |
| Baltimore/Washington International (BWI) | Ground Stop Programs | thunderstorms | – | 17:40 to 22:00 (4 hours 20 minutes) |
| Philadelphia International (PHL) | Ground Stop Programs | thunderstorms | – | 19:20 to 22:00 (2 hours 40 minutes) |
| Raleigh-Durham International (RDU) | Ground Stop Programs | thunderstorms | – | 00:00 to 01:20 (1 hour 20 minutes) |
| Phoenix Sky Harbor International (PHX) | Ground Stop Programs | thunderstorms | – | 03:40 to 04:40 (1 hour) |
| San Francisco International (SFO) | Ground Stop Programs | other | – | 04:40 to 05:40 (1 hour) |
| DJT | Ground Stop Programs | other | – | 05:00 to 05:40 (40 minutes) |
Thunderstorms Were the Leading Cause of Delay Programmes
Thunderstorms were the primary reason behind most delay programmes on July 21, cited in 365 instances for the
FAA’s initiatives related to weather. The top causes include the FAA initiative code “TM Initiatives:SWAP:WX” with 189 reports, and the more specific “WX:Thunderstorms” contributing another 60 reports. Together, these weather-related causes dominated the FAA delay feeds.
Other causes identified included a general category of “other,” accounting for 38 programmes, and an additional 18 instances simply noted as “OTHER.” Every Ground Stop Programme affecting the busiest airports such as LGA, EWR, JFK, BOS, and PHL cited thunderstorms as the reason.
Delay Volume Increased from Previous Day and Weekly Average
Compared with July 20, 2026, yesterday’s data showed 19 airports affected and a total of 27 programmes. The 25 airports and
41 programmes active on July 21 reflect an increase of 6 airports and 14 programmes over the previous day. The seven-day average for airports affected stands at 20.3, placing July 21 above the recent weekly average but not marking the worst in the tracked window for delay activity.
This data set is compiled from FAA data tracked by travelandtournews.com.
Methodology. travelandtournews.com samples the FAA’s National Airspace System status feed every 20 minutes throughout the US operating day and aggregates the result. This report is built from 67 samples taken between 00:00 and 22:00 UTC on 2026-07-21. Durations are the observed
window between the first and last sample in which a programme was in force, so a programme’s true length may be slightly longer than shown. Ground stops, ground delay programmes, airport closures and general delays are all published by the FAA in real time; the daily aggregation is ours.