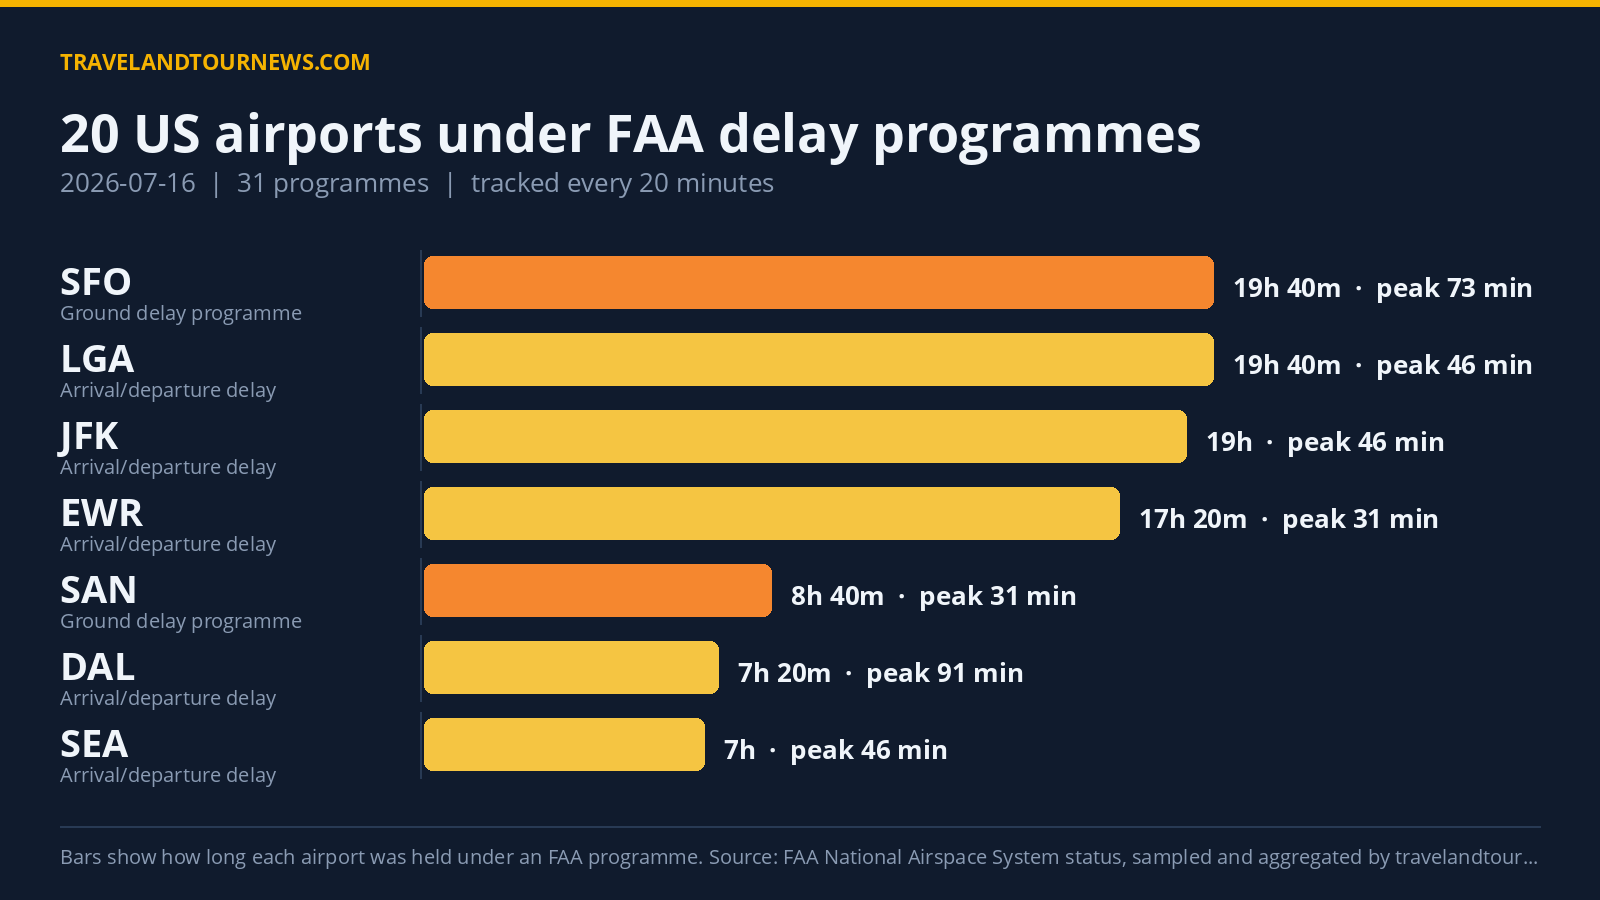

On July 16, 2026, the FAA held 20 airports in the United States under 31 total delay programmes. The worst-hit airport was Seattle-Tacoma International Airport (SEA), where peak maximum delays reached 417 minutes under a Ground Delay Programme and Ground Stop Programs combined.
Delay Programmes by Airport and Duration
The FAA data tracked by travelandtournews.com shows that 6 Ground Stop Programs and 6 Ground Delay Programs were active during the day, alongside 19 general arrival and departure delay information reports. Ground Stops hold departures bound for an airport on the ground, while Ground Delay Programmes meter arrivals by assigning later departure times.
Seattle-Tacoma International (SEA) experienced two types of control: a Ground Stop Program from 17:20 to 20:00 UTC lasting 2 hours 40 minutes with reasons listed as thunderstorms and other causes, and a Ground Delay Program from 20:20 to 22:00 UTC lasting 1 hour 40 minutes attributed to
thunderstorms. Despite no peak average delay recorded during the Ground Stop, the Ground Delay Program at SEA saw peak average delays of 31 minutes and a maximum delay of 192 minutes.
San Francisco International Airport (SFO) had a Ground Stop Program lasting 40 minutes early in the day and a lengthy Ground Delay Program lasting nearly 19 hours and 40 minutes from 02:20 to 22:00 UTC with peak average delays of 73 minutes and peak maximum delays of 229 minutes, all due to other causes.
Other notable Ground Stop Programs included Aspen (ASE) for 40 minutes due to airport volume,
Orlando International (MCO) for 40 minutes caused by thunderstorms, and brief one-sample stops at Dallas Love Field (DAL) and Dallas/Fort Worth (DFW) airports due to thunderstorms.
Ground Delay Programs spanning multiple hours were also recorded at Newark Liberty International (EWR) and Teterboro Airport (TEB) for 2 hours each due to other reasons. Philadelphia (PHL) faced a Ground Delay Program lasting 6 hours 20 minutes due to low visibility, while San Diego (SAN) had an extensive Ground Delay Program lasting 8 hours 40 minutes attributed to airport volume.
| Airport | FAA programme | Cause | Peak average delay | In force (UTC) |
|---|---|---|---|---|
| Seattle-Tacoma International (SEA) | Ground Stop Programs | thunderstorms; other | – | 17:20 to 20:00 (2 hours 40 minutes) |
| San Francisco International (SFO) | Ground Stop Programs | other | – | 04:40 to 05:20 (40 minutes) |
| ASE | Ground Stop Programs | airport volume | – | 17:00 to 17:40 (40 minutes) |
| Orlando International (MCO) | Ground Stop Programs | thunderstorms | – | 19:20 to 20:00 (40 minutes) |
| Dallas/Fort Worth International (DFW) | Ground Stop Programs | thunderstorms | – | 20:00 to 20:00 (20 minutes) |
| Dallas Love Field (DAL) | Ground Stop Programs | thunderstorms | – | 20:00 to 20:00 (20 minutes) |
| TEB | Ground Delay Programs | other | 219 min | 02:20 to 04:20 (2 hours) |
| Newark Liberty International (EWR) | Ground Delay Programs | other | 199 min | 02:20 to 04:20 (2 hours) |
| San Francisco International (SFO) | Ground Delay Programs | other | 73 min | 02:20 to 22:00 (19 hours 40 minutes) |
| Philadelphia International (PHL) | Ground Delay Programs | low visibility | 66 min | 15:40 to 22:00 (6 hours 20 minutes) |
| San Diego International (SAN) | Ground Delay Programs | airport volume | 31 min | 13:20 to 22:00 (8 hours 40 minutes) |
| Seattle-Tacoma International (SEA) | Ground Delay Programs | thunderstorms | 31 min | 20:20 to 22:00 (1 hour 40 minutes) |
| Dallas Love Field (DAL) | General Arrival/Departure Delay Info | WX:Thunderstorms | 91 min | 14:40 to 22:00 (7 hours 20 minutes) |
| Dallas/Fort Worth International (DFW) | General Arrival/Departure Delay Info | WX:Thunderstorms | 91 min | 16:20 to 22:00 (5 hours 40 minutes) |
Causes Behind the Delay Programmes
The top reasons driving FAA delay programmes on July 16 were primarily other
unspecified causes with 59 mentions, followed by thunderstorm weather conditions with 36 mentions. Airport volume accounted for 30 mentions, and low visibility contributed to 20 reported causes.
Thunderstorms drove or contributed to 6 Ground Stop Programs including SEA, MCO, DAL, DFW, as well as general delay reports at Dallas Love Field (DAL), Dallas/Fort Worth (DFW), Atlanta (ATL), and Boston Logan (BOS). Airport volume was notable at Aspen (ASE) and San Diego (SAN). Low visibility also significantly affected Philadelphia (PHL) and Chicago O’Hare International (ORD).
Other operational factors reported included runway maintenance and disabled aircraft incidents primarily at Seattle and Chicago
O’Hare. Traffic management initiatives related to weather swaps and compacted demand were noted at LaGuardia (LGA), JFK, and Newark (EWR).
Comparison Against Recent Averages
Compared with the recent three-day average of 16.3 airports affected, the 20 airports under delay programmes on July 16 represents the highest in our tracking window. No data is available for yesterday for direct daily comparison.
Methodology. travelandtournews.com samples the FAA’s National Airspace System status feed every 20 minutes throughout the US operating day and aggregates the result. This report is built from 60 samples taken between 02:20 and 22:00 UTC on 2026-07-16. Durations are the observed window between the
first and last sample in which a programme was in force, so a programme’s true length may be slightly longer than shown. Ground stops, ground delay programmes, airport closures and general delays are all published by the FAA in real time; the daily aggregation is ours.