
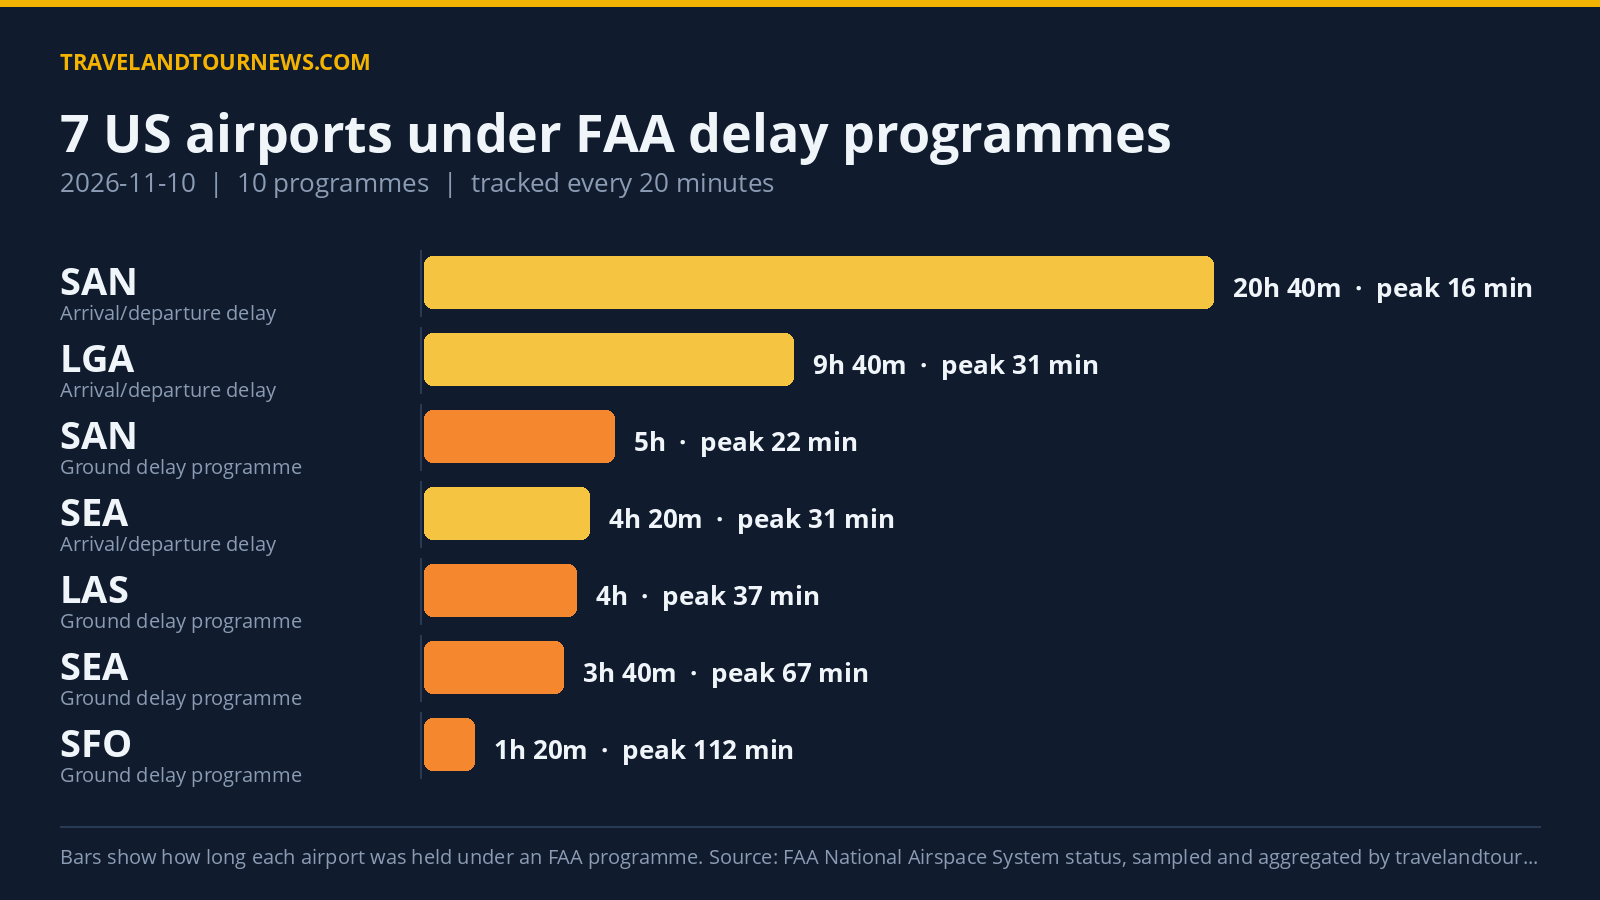

On November 10, the FAA implemented 10 delay programmes affecting seven U.S. airports, as tracked by travelandtournews.com. The worst-hit airport was San Francisco International (SFO), where ground delay programmes produced a peak average delay of 112 minutes and a maximum delay of 439 minutes.
Seven Airports Saw Delays Under Various FAA Programmes
The delay programmes covered LaGuardia (LGA), Teterboro (TEB), San Francisco (SFO), Seattle-Tacoma (SEA), Harry Reid International (LAS), San Diego (SAN), and Phoenix Sky Harbor (PHX). They comprised two ground stop programmes, which hold departures destined for an airport on the ground at their origin, four ground delay programmes that meter arrivals by assigning later departure times, and four general arrival/departure delay information advisories.
Ground stops were enforced at LaGuardia and Teterboro, each lasting about 40 minutes; both cited airport volume as the cause. LaGuardia’s ground stop was observed between 00:20 and 01:00 UTC, and Teterboro’s between 21:00 and 21:40 UTC.
Ground delay programmes were active at five airports. San Francisco’s ground delays lasted 1 hour 20 minutes, driven by low ceilings, producing the highest peak average and maximum delays globally on the day. Seattle endured ground delay programmes for 3 hours 40 minutes with unspecified ‘other’ causes. Harry Reid International’s programme stretched 4 hours, also with ‘other’ causes. San Diego experienced a 5-hour ground delay programme caused by airport volume. San Francisco, Seattle, and Las Vegas saw general arrival/departure delays, as did Phoenix and San Diego.
| Airport | FAA programme | Cause | Peak average delay | In force (UTC) |
|---|---|---|---|---|
| LaGuardia (LGA) | Ground Stop Programs | airport volume | – | 00:20 to 01:00 (40 minutes) |
| TEB | Ground Stop Programs | airport volume | – | 21:00 to 21:40 (40 minutes) |
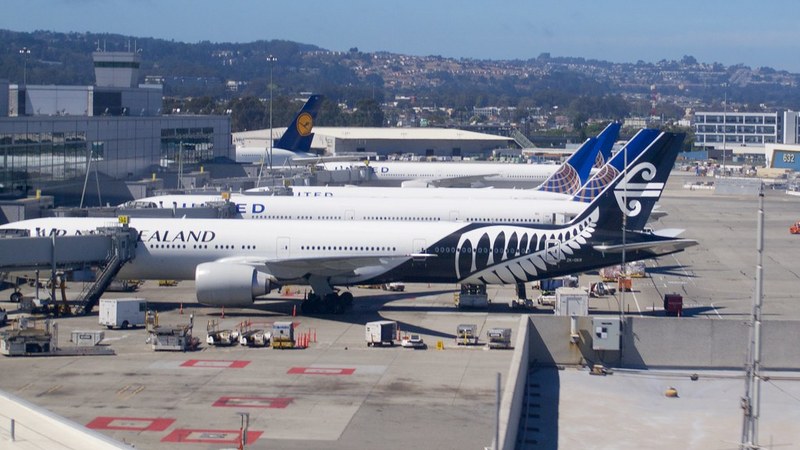
| San Francisco International (SFO) | Ground Delay Programs | low ceilings | 112 min | 00:00 to 01:20 (1 hour 20 minutes) |
| Seattle-Tacoma International (SEA) | Ground Delay Programs | other | 67 min | 01:20 to 05:00 (3 hours 40 minutes) |
| Harry Reid International (LAS) | Ground Delay Programs | other | 37 min | 02:00 to 06:00 (4 hours) |
| San Diego International (SAN) | Ground Delay Programs | airport volume | 22 min | 00:00 to 05:00 (5 hours) |
| LaGuardia (LGA) | General Arrival/Departure Delay Info | WX:Wind | 31 min | 00:00 to 09:40 (9 hours 40 minutes) |
| Seattle-Tacoma International (SEA) | General Arrival/Departure Delay Info | RWY:Construction | 31 min | 17:00 to 21:20 (4 hours 20 minutes) |
| San Diego International (SAN) | General Arrival/Departure Delay Info | VOL:Compacted Demand | 16 min | 00:00 to 20:40 (20 hours 40 minutes) |
| Phoenix Sky Harbor International (PHX) | General Arrival/Departure Delay Info | VOL:Multi-taxi | 16 min | 17:20 to 17:40 (20 minutes) |
Logged Causes for Delay Programmes Highlight Volume and Weather as Top Drivers
The FAA’s own stated causes of delay on November 10 highlight ‘VOL:Compacted Demand’ as
the leading driver, triggering 34 programme instances. Wind effects (‘WX:Wind’) were second with 30 instances, followed by unspecified ‘other’ causes at 25. Airport volume itself factored into 22 recorded instances, while runway construction caused 11.
LaGuardia’s ground stop and San Diego’s ground delay programme were both specifically attributed to airport volume. San Francisco’s substantial ground delay programme resulted from low ceiling conditions. Seattle’s 12 ground delay programme samples were all classified as ‘other’, while later runway construction at SEA also generated delay info advisories. Phoenix’s minor delay programme stemmed from multi-taxi volume issues.
Delay Volume Was Below Yesterday’s but Similar To Weekly Average
Compared to the previous day, today’s delay
programmes affected five fewer airports (7 versus 12) and had six fewer programmes in force (10 versus 16). The number of affected airports (7) was also below the seven-day average of 11.4. Despite this decrease, the day did not produce the worst delay figures in the tracking window.
The FAA data underlying this report was sourced from the National Airspace System status feed and sampled all day by travelandtournews.com.
Methodology. travelandtournews.com samples the FAA’s National Airspace System status feed every 20 minutes throughout the US operating day and aggregates the result. This report is built from 68 samples taken between
00:00 and 22:20 UTC on 2026-11-10. Durations are the observed window between the first and last sample in which a programme was in force, so a programme’s true length may be slightly longer than shown. Ground stops, ground delay programmes, airport closures and general delays are all published by the FAA in real time; the daily aggregation is ours.