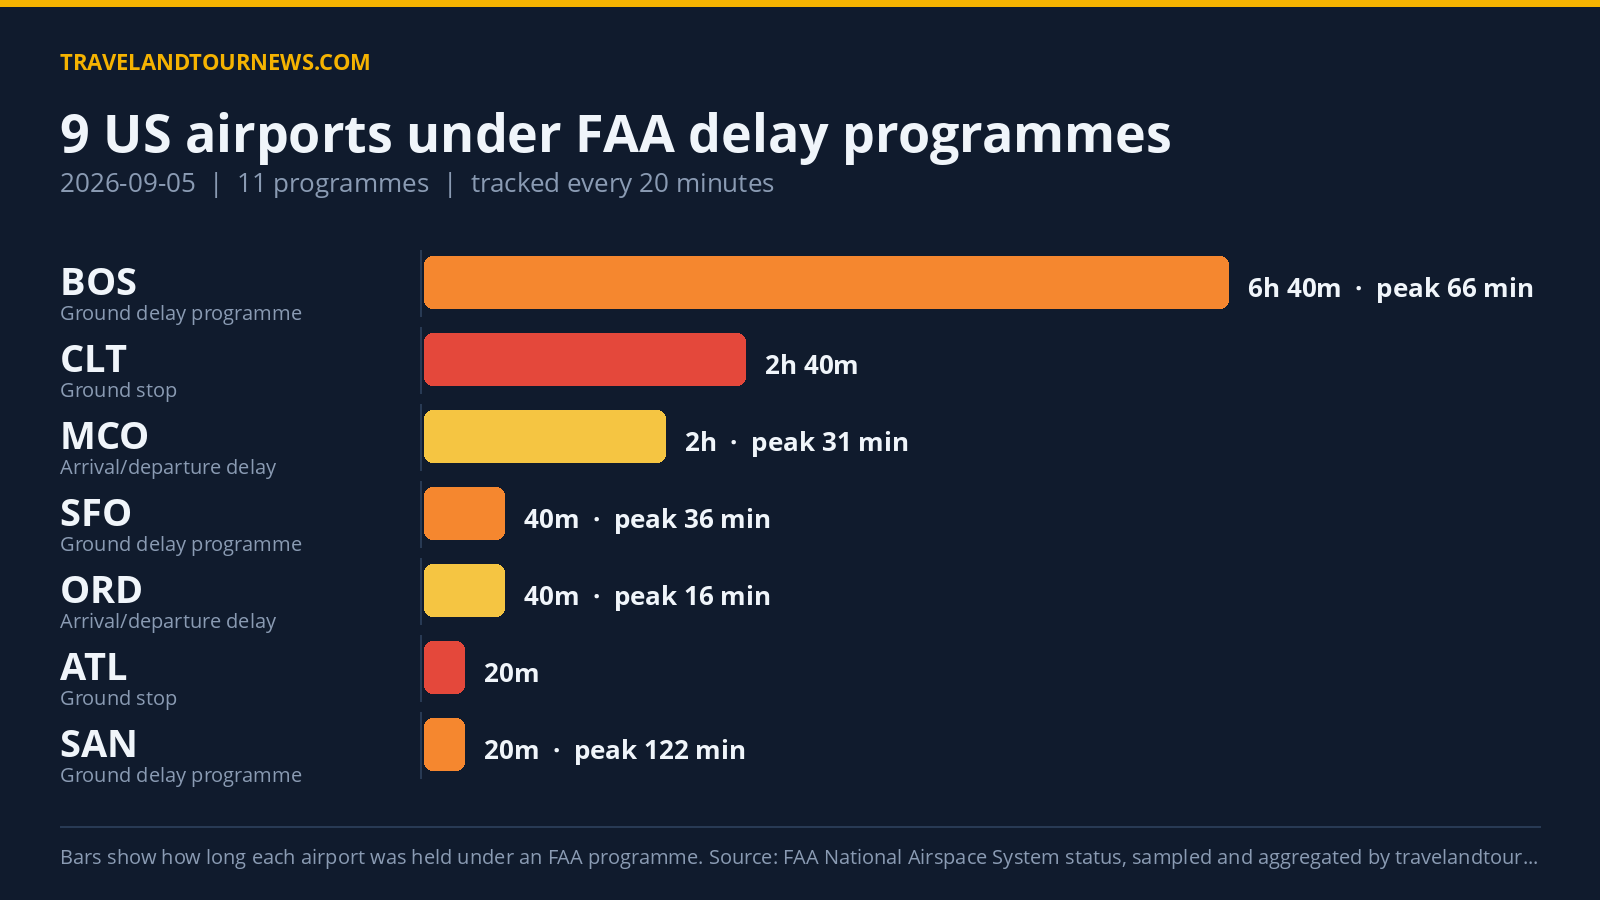

On September 5, 2026, the FAA held nine airports in the United States under 11 delay programmes, with Charlotte Douglas International (CLT) experiencing the worst disruption through a ground stop lasting 2 hours and 40 minutes. The largest peak delay recorded was 384 minutes at San Diego International (SAN) during a ground delay programme caused by security concerns.
Nine Airports Experienced Various FAA Delay Programmes
The nine affected airports on September 5 were ATL, BOS, CLT, FLL, MCO, MIA, ORD, SAN, and SFO. Delay programmes included two ground stops, where departures bound for the airport were held on the ground, and three ground delay programmes, which meter arrivals by assigning later departure times. The remaining six programmes provided general arrival and departure delay information.
The longest programme was the ground delay programme at Boston Logan International (BOS), which lasted 6 hours and 40 minutes, originating from runway construction issues and peaked with an average delay of 66 minutes and a maximum of 163 minutes. CLT’s
ground stop programme, triggered by thunderstorms, was active for 2 hours and 40 minutes but showed no measurable peak delays in the observations. San Diego’s single-sample ground delay due to security issues showed the highest peak average delay of 122 minutes and a maximum delay of 384 minutes recorded in the day.
| Airport | FAA programme | Cause | Peak average delay | In force (UTC) |
|---|---|---|---|---|
| Charlotte Douglas International (CLT) | Ground Stop Programs | thunderstorms | – | 19:20 to 22:00 (2 hours 40 minutes) |
| Hartsfield-Jackson Atlanta International (ATL) | Ground Stop Programs | thunderstorms | – | 22:00 to 22:00 (20 minutes) |
| San Diego International (SAN) | Ground Delay Programs | security | 122 min | 02:40 to 02:40 (20 minutes) |
| Boston Logan International (BOS) | Ground Delay Programs | runway construction | 66 min | 15:20 to 22:00 (6 hours 40 minutes) |
| San Francisco International (SFO) | Ground Delay Programs | low ceilings | 36 min | 13:20 to 14:00 (40 minutes) |
| Orlando International (MCO) | General Arrival/Departure Delay Info | TM Initiatives:MIT:WX | 31 min | 20:00 to 22:00 (2 hours) |
| Fort Lauderdale-Hollywood International (FLL) | General Arrival/Departure Delay Info | TM Initiatives:MIT:WX | 31 min | 21:40 to 21:40 (20 minutes) |
| Miami International (MIA) | General Arrival/Departure Delay Info | TM Initiatives:MIT:WX | 31 min | 21:40 to 22:00 (20 minutes) |
| Chicago O’Hare International (ORD) | General Arrival/Departure Delay Info | WX:Low Ceilings | 16 min | 12:40 to 13:20 (40 minutes) |
| San Diego International (SAN) | General Arrival/Departure Delay Info | VOL:Compacted Demand | 16 min | 02:40 to 02:40 (20 minutes) |
| San Francisco International (SFO) | General Arrival/Departure Delay Info | RWY:Construction | 16 min | 18:40 to 19:00 (20 minutes) |
Runway Construction and Weather Were Primary Causes of Delay
Runway construction caused the most delay programmes, driving 21 observations, mostly impacting Boston Logan (BOS). Weather-related issues, especially thunderstorms, were the next significant cause with 6 programmes, including the lengthy ground stop at Charlotte Douglas (CLT) and a brief ground stop at Hartsfield-Jackson Atlanta (ATL). Additional weather-related causes
included three programmes citing low ceilings—seen in San Francisco (SFO) and Chicago O’Hare (ORD).
Other notable causes were traffic management initiatives related to weather at Orlando (MCO), Fort Lauderdale (FLL), and Miami (MIA), each with delays averaging 31 minutes. Security was the cause of the significant delay at San Diego (SAN) during its ground delay programme. Lastly, volume-related demand compaction affected SAN again but only showed minor delay in general delay info.
Fewer Airports and Programs Compared to Recent Days
Compared with September 4, 2026, the number of airports affected dropped from 25 to 9, and the total programmes fell sharply from 39 to 11. Against the 7-day
average of roughly 20 airports affected, today’s figure is also substantially lower. This day was not the worst within the tracking window. Today’s peak average delay was 122 minutes, recorded at SAN, with a peak maximum delay reaching 384 minutes.
Methodology. travelandtournews.com samples the FAA’s National Airspace System status feed every 20 minutes throughout the US operating day and aggregates the result. This report is built from 39 samples taken between 02:40 and 22:00 UTC on 2026-09-05. Durations are the observed window between the first and last sample in which a programme was in force, so a programme’s true length
may be slightly longer than shown. Ground stops, ground delay programmes, airport closures and general delays are all published by the FAA in real time; the daily aggregation is ours.