
On July 17, 2026, the FAA held 23 airports across the United States under 36 delay programmes in total. The worst-affected airport was Hartsfield-Jackson Atlanta International (ATL), where a ground stop programme due to thunderstorms lasted 3 hours 20 minutes.
Ground Stop and Ground Delay Programmes at 23 Airports
The FAA implemented 9 ground stop programmes, which hold departures bound for the affected airport on the ground at their origin, and 9 ground delay programmes, which assign later departure times to meter arrivals. Additionally, 18 general arrival/departure delay information programmes were active, which report overall delay conditions without a formal ground stop or delay programme.
ATL’s ground stop programme, driven by thunderstorms, was observed over 200 minutes from 18:40 to 22:00 UTC. Orlando International (MCO) had a ground stop for 2 hours 20 minutes (18:20 to 20:40 UTC) also due to thunderstorms. Dallas/Fort Worth International (DFW) had a two-hour
thunderstorm-related ground stop early in the day, from midnight to 02:00 UTC. Tampa International (TPA) and Nashville (BNA) likewise had shorter thunderstorm-related ground stops lasting 1 hour 40 minutes and 1 hour respectively.
Harry Reid International (LAS) experienced a ground stop for staffing issues lasting 40 minutes, while Boston Logan (BOS) had a brief 20-minute ground stop due to wind. Washington New Jersey’s Teterboro Airport (TEB) recorded two ground stops totaling 40 minutes, related to staffing and other reasons.
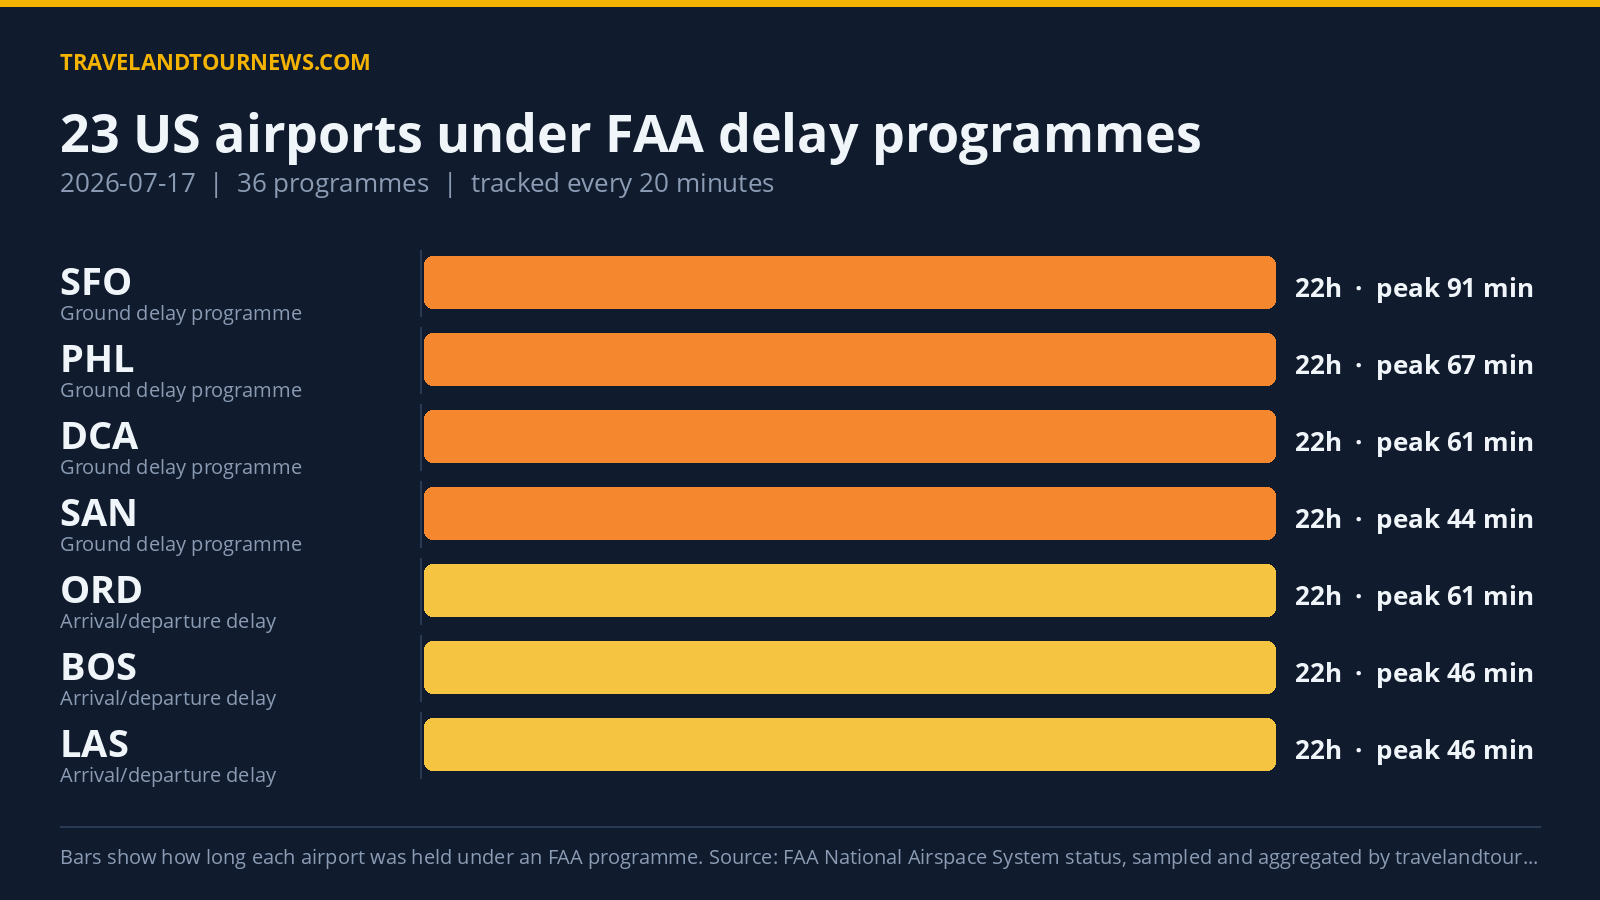
Ground delay programmes included a lengthy 22-hour programme at San Francisco International (SFO) due to unspecified “other” causes, with peak average
delays of 91 minutes and maximum delays reaching 562 minutes. Philadelphia International (PHL) also had a 22-hour ground delay programme driven by low visibility, averaging 67 minutes delay with peaks to 125 minutes. Similar duration ground delays were in place at Ronald Reagan Washington National (DCA) for wind and low visibility, and at San Diego International (SAN) due to airport volume; SAN recorded a maximum peak delay of 930 minutes.
Chicago O’Hare (ORD) had an extended 4-hour ground delay programme caused by thunderstorms, averaging 105 minutes delay with a maximum of 261 minutes. Seattle-Tacoma International (SEA) experienced a nearly 5-hour
thunderstorm-related ground delay. Several airports experienced shorter ground delays: Newark Liberty (EWR) logged a 2-hour delay for various other reasons, while Teterboro (TEB) had a 1 hour 40 minute ground delay program for “other” causes with a peak average delay of 212 minutes. Las Vegas (LAS) combined a ground delay of over 5 hours for other reasons with an earlier ground stop.
| Airport | FAA programme | Cause | Peak average delay | In force (UTC) |
|---|---|---|---|---|
| Hartsfield-Jackson Atlanta International (ATL) | Ground Stop Programs | thunderstorms | – | 18:40 to 22:00 (3 hours 20 minutes) |
| Orlando International (MCO) | Ground Stop Programs | thunderstorms | – | 18:20 to 20:40 (2 hours 20 minutes) |
| Dallas/Fort Worth International (DFW) | Ground Stop Programs | thunderstorms | – | 00:00 to 02:00 (2 hours) |
| Tampa International (TPA) | Ground Stop Programs | thunderstorms | – | 18:00 to 19:40 (1 hour 40 minutes) |
| BNA | Ground Stop Programs | thunderstorms | – | 20:40 to 21:40 (1 hour) |
| Harry Reid International (LAS) | Ground Stop Programs | STAFFING | – | 06:40 to 07:20 (40 minutes) |
| Boston Logan International (BOS) | Ground Stop Programs | wind | – | 00:00 to 00:00 (20 minutes) |
| YVR | Ground Stop Programs | thunderstorms | – | 04:40 to 04:40 (20 minutes) |
| TEB | Ground Stop Programs | STAFFING | – | 19:40 to 20:00 (20 minutes) |
| TEB | Ground Delay Programs | other | 212 min | 20:20 to 22:00 (1 hour 40 minutes) |
| Chicago O’Hare International (ORD) | Ground Delay Programs | thunderstorms | 105 min | 18:00 to 22:00 (4 hours) |
| Harry Reid International (LAS) | Ground Delay Programs | other | 95 min | 02:00 to 07:20 (5 hours 20 minutes) |
| San Francisco International (SFO) | Ground Delay Programs | other | 91 min | 00:00 to 22:00 (22 hours) |
| Philadelphia International (PHL) | Ground Delay Programs | low visibility | 67 min | 00:00 to 22:00 (22 hours) |
Thunderstorms Drove Six of the Nine Ground Stop Programmes
Thunderstorms were the leading cause of ground stops, underpinning six of the nine ground stop programmes recorded: ATL, MCO, DFW, TPA, BNA, and YVR. Other ground stops were due to staffing (LAS, TEB) and wind (BOS).
Among ground
delay programmes, causes varied. Thunderstorms led the delays at ORD and SEA. The lengthy programme at SFO was attributed to “other” unspecified causes, as was the significant TEB delay. Low visibility prompted delays at PHL, and wind plus low visibility caused delays at DCA. Airport volume was the prime cause at SAN. These five causes appeared most frequently, matching the FAA’s official delay reasons logged over the day. Other reasons included traffic management initiatives related to weather and volume.
July 17 Delay Figures Surpass Previous Days in Programmes and Airports Affected
FAA data tracked by travelandtournews.com shows 36 programmes on July 17, up from 31 the previous day. The number of affected
airports increased to 23 from 20 yesterday, and above the recent four-day average of 17.2 affected airports. This marks the highest level observed within the current tracking window.
Peak average delay minutes reached 212 minutes in TEB’s ground delay programme for other reasons, while peak maximum delays topped 930 minutes at SAN due to airport volume. ATL’s continuous three-hour 20-minute thunderstorm-related ground stop was the longest single ground stop reported on July 17.
Methodology. travelandtournews.com samples the FAA’s National Airspace System status feed every 20 minutes throughout the US operating day and aggregates the result. This report is built from
67 samples taken between 00:00 and 22:00 UTC on 2026-07-17. Durations are the observed window between the first and last sample in which a programme was in force, so a programme’s true length may be slightly longer than shown. Ground stops, ground delay programmes, airport closures and general delays are all published by the FAA in real time; the daily aggregation is ours.