
On September 2, 2026, 19 airports across the United States were subject to 34 FAA delay programmes. The highest peak average delay recorded was 298 minutes at Toronto Pearson International Airport (YYZ), according to FAA data tracked by travelandtournews.com.
FAA Delay Programmes Affect Multiple Airports
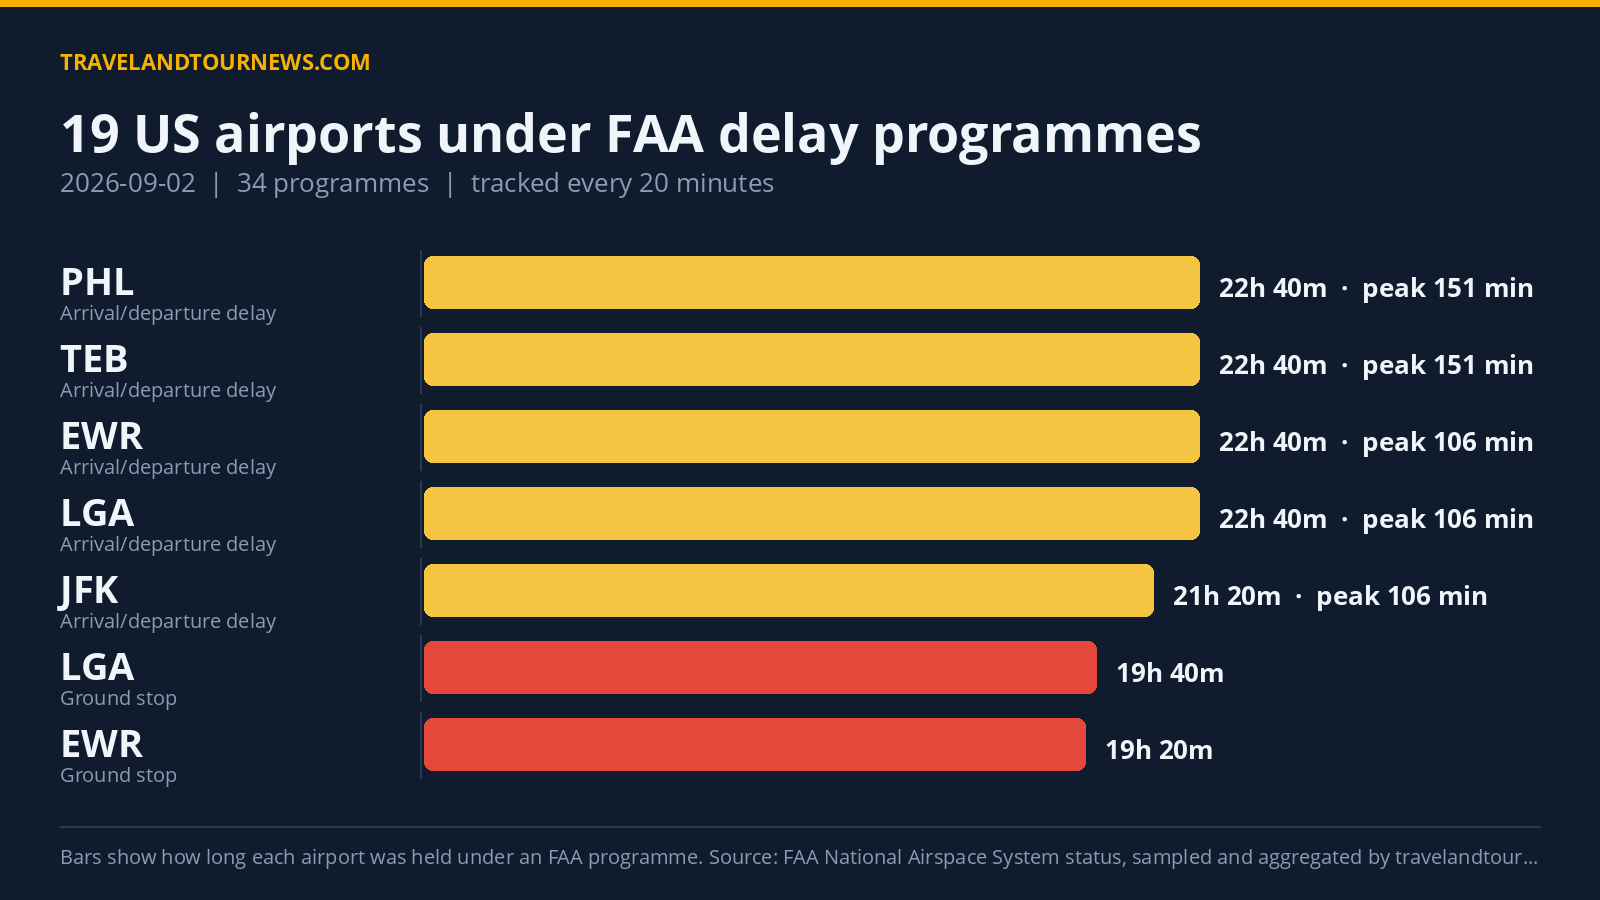
The 34 programmes included 11 Ground Stop Programs, which hold departures bound for an airport on the ground at their origin, 7 Ground Delay Programs, which meter arrivals by assigning later departure times, and 16 General Arrival/Departure Delay Information announcements. The most widely affected airport was LaGuardia (LGA), which experienced 26 Ground Stop Program samples related exclusively to thunderstorms, spanning nearly 20 hours from midnight to 19:40 UTC. No peak delay minutes were reported for LGA’s ground stops.
Toronto Pearson International (YYZ) had 14 Ground Stop Program samples linked to low visibility and thunderstorms between 10:00 and 22:20 UTC, lasting
12 hours and 20 minutes without recorded peak delay minutes. However, YYZ also faced a Ground Delay Program due to thunderstorms from 17:00 to 22:40 UTC with the day’s highest peak average delay of 298 minutes and a maximum delay of 1,441 minutes over 5 hours and 40 minutes.
Newark Liberty International (EWR) was under a 19-hour 20-minute Ground Stop Program for thunderstorms and a 5-hour 20-minute Ground Delay Program also related to thunderstorms, where peak average delays reached 239 minutes. John F. Kennedy International (JFK) had an early 3-hour 20-minute Ground Stop Program for thunderstorms and a 6-hour Ground
Delay Program with peak average delays of 106 minutes. Philadelphia International (PHL) had multiple programmes totaling over 7 hours 40 minutes under delay information and Ground Delay Program notices mainly driven by thunderstorms.
Other airports with Ground Stop Programs mostly related to thunderstorms included Baltimore/Washington International (BWI), Ronald Reagan Washington National (DCA), Washington Dulles International (IAD), and Teterboro (TEB). Boston Logan International (BOS) faced a brief Ground Stop Program and Ground Delay Program both due to runway construction.
| Airport | FAA programme | Cause | Peak average delay | In force (UTC) |
|---|---|---|---|---|
| LaGuardia (LGA) | Ground Stop Programs | thunderstorms | – | 00:00 to 19:40 (19 hours 40 minutes) |
| Newark Liberty International (EWR) | Ground Stop Programs | thunderstorms | – | 00:00 to 19:20 (19 hours 20 minutes) |
| YYZ | Ground Stop Programs | low visibility; thunderstorms | – | 10:00 to 22:20 (12 hours 20 minutes) |
| John F. Kennedy International (JFK) | Ground Stop Programs | thunderstorms | – | 00:00 to 03:20 (3 hours 20 minutes) |
| Baltimore/Washington International (BWI) | Ground Stop Programs | thunderstorms | – | 17:00 to 20:00 (3 hours) |
| Ronald Reagan Washington National (DCA) | Ground Stop Programs | thunderstorms | – | 17:20 to 20:00 (2 hours 40 minutes) |
| TEB | Ground Stop Programs | THUNDERSTORMS; thunderstorms | – | 17:00 to 19:20 (2 hours 20 minutes) |
| Washington Dulles International (IAD) | Ground Stop Programs | thunderstorms | – | 18:00 to 20:00 (2 hours) |
| YUL | Ground Stop Programs | airport volume | – | 20:20 to 21:20 (1 hour) |
| Philadelphia International (PHL) | Ground Stop Programs | thunderstorms | – | 02:40 to 03:20 (40 minutes) |
| Boston Logan International (BOS) | Ground Stop Programs | runway construction | – | 22:20 to 22:40 (20 minutes) |
| YYZ | Ground Delay Programs | thunderstorms | 298 min | 17:00 to 22:40 (5 hours 40 minutes) |
| Newark Liberty International (EWR) | Ground Delay Programs | thunderstorms | 239 min | 00:00 to 05:20 (5 hours 20 minutes) |
| John F. Kennedy International (JFK) | Ground Delay Programs | thunderstorms | 106 min | 16:40 to 22:40 (6 hours) |
Thunderstorms Drove Most Delay Programmes
Thunderstorms were the leading cause of delay programmes, appearing in 193 cases followed by the FAA’s Traffic Management Initiatives linked to weather
(TM Initiatives:SWAP:WX) with 209 mentions. Low ceilings and low visibility also contributed as delay causes. Toronto and New York area airports were most affected by thunderstorm-related delays. Other notable causes included airport volume delays at Montreal-Trudeau (YUL) and runway construction at Boston Logan.
Stable Delay Levels Compared to Recent Data
The number of airports affected and total delay programmes on September 2, 2026, were consistent with the previous day’s figures, with 19 airports affected and 34 programmes, yielding no change in the count of programmes compared to September 1. The daily airport impact aligns closely with the seven-day average of 18.4 affected airports, indicating typical levels of
congestion and weather impact within this tracking window.
All data is sourced from FAA delay feeds aggregated and tracked by travelandtournews.com.
Methodology. travelandtournews.com samples the FAA’s National Airspace System status feed every 20 minutes throughout the US operating day and aggregates the result. This report is built from 52 samples taken between 00:00 and 22:40 UTC on 2026-09-02. Durations are the observed window between the first and last sample in which a programme was in force, so a programme’s true length may be slightly longer than shown. Ground stops, ground delay programmes, airport closures and general delays are all published
by the FAA in real time; the daily aggregation is ours.