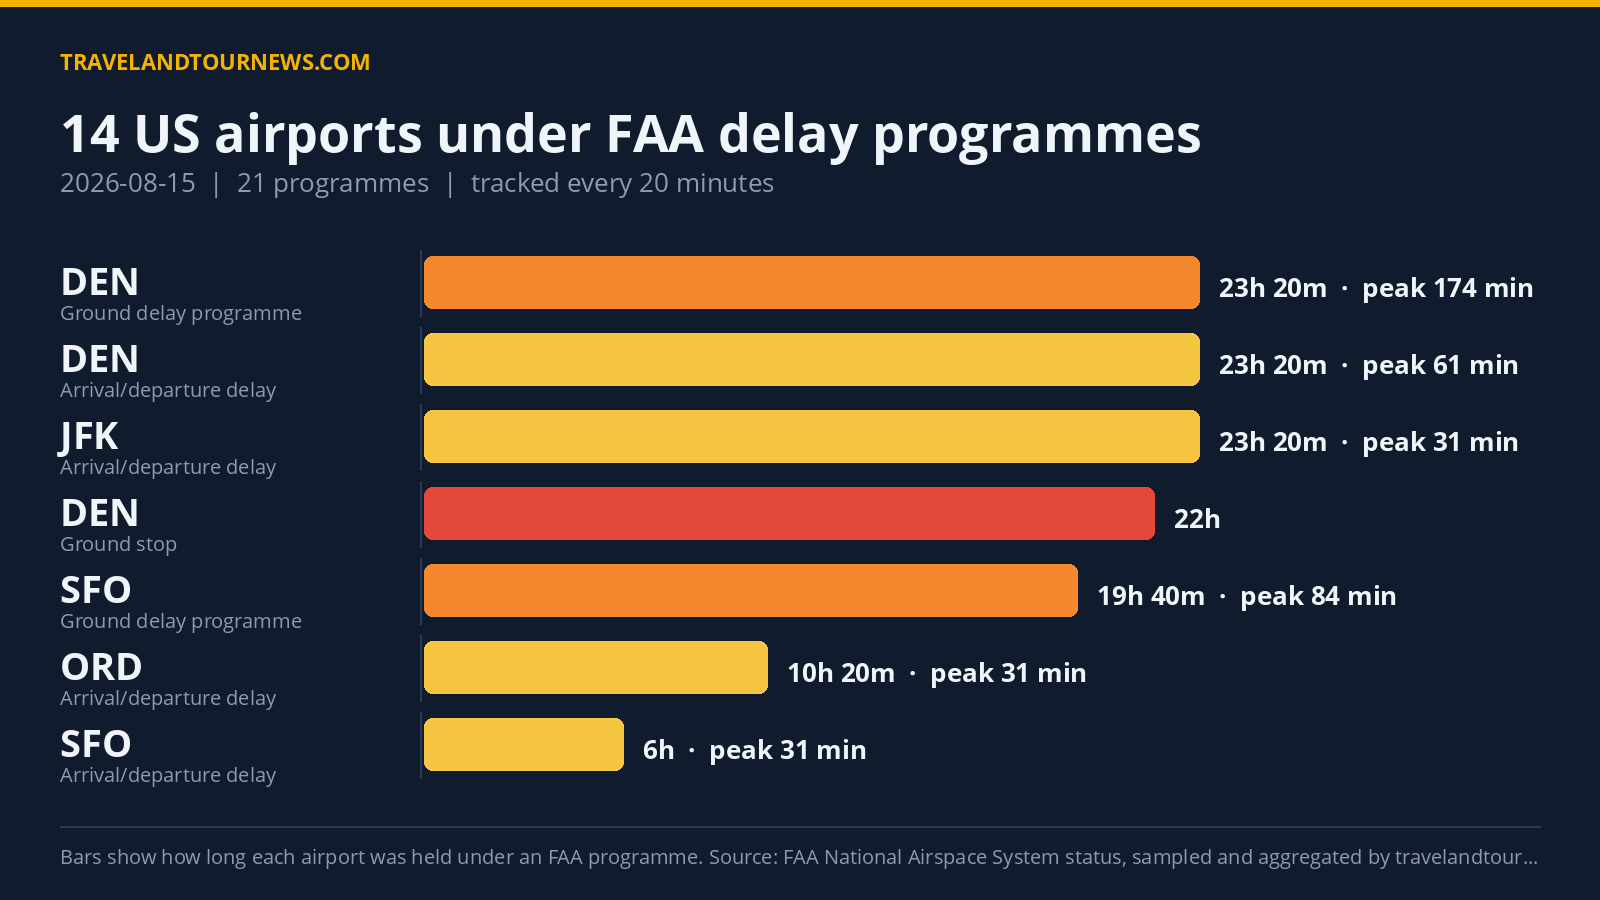

On August 15, 2026, FAA delay programmes affected 14 airports across the United States, with a total of 21 programmes in force. Denver International Airport (DEN) was the worst impacted, where ground delay programmes caused peak delays of up to 1135 minutes.
FAA Delay Programmes Impact 14 Airports Across the U.S.
The day saw 5 ground stop programmes, which hold departures at their origin airports, and 5 ground delay programmes, which assign later departure times to meter arrivals at destination airports. The remaining 11 were general arrival/departure delay information releases.
Denver International Airport had the longest ground delay programme, in place for nearly 23 hours and 20 minutes, with 22 samples recorded. Denver’s ground stop programme also persisted for 22 hours. Peak average delay there was 174 minutes. Other airports with ground stop programmes included Harry Reid International (LAS) affected for 1 hour 40 minutes and Hartsfield-Jackson Atlanta International (ATL) with
a 20-minute ground stop late in the day.
Several airports experienced shorter ground stop programmes, such as Dallas Love Field (DAL) and Dallas/Fort Worth International (DFW), each with brief 20-minute stops. Ground delay programmes of notable length were also seen at San Francisco International (SFO) for 19 hours and 40 minutes, and San Diego International (SAN) for 4 hours and 20 minutes, both driven by weather and volume factors.
General arrival/departure delay info was active for up to 23 hours and 20 minutes at JFK, covering various traffic management initiatives. Chicago O’Hare (ORD) had roughly 10 hours and 20 minutes
of general delay information, citing thunderstorms and low ceilings.
| Airport | FAA programme | Cause | Peak average delay | In force (UTC) |
|---|---|---|---|---|
| Denver International (DEN) | Ground Stop Programs | thunderstorms | – | 00:00 to 22:00 (22 hours) |
| Harry Reid International (LAS) | Ground Stop Programs | wind; thunderstorms | – | 02:00 to 03:40 (1 hour 40 minutes) |
| Dallas Love Field (DAL) | Ground Stop Programs | OCL: | – | 16:00 to 16:00 (20 minutes) |
| Dallas/Fort Worth International (DFW) | Ground Stop Programs | OCL: | – | 16:00 to 16:00 (20 minutes) |
| Hartsfield-Jackson Atlanta International (ATL) | Ground Stop Programs | thunderstorms | – | 23:20 to 23:20 (20 minutes) |
| Denver International (DEN) | Ground Delay Programs | thunderstorms | 174 min | 00:00 to 23:20 (23 hours 20 minutes) |
| Harry Reid International (LAS) | Ground Delay Programs | wind; thunderstorms | 159 min | 00:00 to 05:20 (5 hours 20 minutes) |
| San Francisco International (SFO) | Ground Delay Programs | low ceilings | 84 min | 00:00 to 19:40 (19 hours 40 minutes) |
| John F. Kennedy International (JFK) | Ground Delay Programs | airport volume | 62 min | 00:00 to 00:40 (40 minutes) |
| San Diego International (SAN) | Ground Delay Programs | airport volume | 50 min | 00:00 to 04:20 (4 hours 20 minutes) |
| Harry Reid International (LAS) | General Arrival/Departure Delay Info | WX:Thunderstorms | 106 min | 00:00 to 05:20 (5 hours 20 minutes) |
| Denver International (DEN) | General Arrival/Departure Delay Info | ZDV / WX:Thunderstorms | 61 min | 00:00 to 23:20 (23 hours 20 minutes) |
| Newark Liberty International (EWR) | General Arrival/Departure Delay Info | TM Initiatives:MINIT:VOL; TM Initiatives:Metering:VOL | 46 min | 00:00 to 01:40 (1 hour 40 minutes) |
| John F. Kennedy International (JFK) | General Arrival/Departure Delay Info | TM Initiatives:SWAP:WX; TM Initiatives:ASP:VOL; TM Initiatives:MIT:VIPM:KIWI | 31 min | 00:00 to 23:20 (23 hours 20 minutes) |
Thunderstorms Lead Causes, Followed by Low Ceilings and Airport Volume
The FAA cited thunderstorms as the leading cause behind 44 of the delay programmes. Low ceilings were a factor in 39 recorded instances, while explicit weather-related thunderstorm mentions appeared 21 times. Airport volume impacted 17 delay programmes, and wind was cited 13 times across various airports.
Denver’s extensive delays are attributed exclusively to thunderstorms. Las Vegas (LAS) faced delays from both wind and thunderstorms. San Francisco’s ground delays stemmed from low ceilings, while New York area airports (JFK, LGA) were affected mainly by traffic management initiatives, including volume and weather considerations.
Delay Metrics Lower Than Previous Day and Weekly Average
Compared with August 14, 2026, which saw 20 airports affected and 34 total programmes, August 15 showed a decrease by 6 in programmes and 6 fewer airports under delay measures. The average over the past 7 days for airports impacted stands at 20, confirming a relatively lighter impact on August 15. August 15 is not the worst day within the recent tracking window.
The maximum observed peak average delay across all airports on August 15 was 174 minutes, with the peak maximum delay reaching 1135 minutes at Denver.
Methodology. travelandtournews.com samples the FAA’s National Airspace System status feed every 20
minutes throughout the US operating day and aggregates the result. This report is built from 71 samples taken between 00:00 and 23:20 UTC on 2026-08-15. Durations are the observed window between the first and last sample in which a programme was in force, so a programme’s true length may be slightly longer than shown. Ground stops, ground delay programmes, airport closures and general delays are all published by the FAA in real time; the daily aggregation is ours.