

On November 14, 2026, the FAA held delay programmes affecting 10 airports across the United States. A total of 11 delay programmes were recorded, with LaGuardia Airport (LGA) experiencing the most severe disruption through a ground stop programme.
Delay Programmes Across 10 Airports
The affected airports were Atlanta (ATL), Boston (BOS), Washington National (DCA), Fort Lauderdale (FLL), Houston Intercontinental (IAH), LaGuardia (LGA), Chicago O’Hare (ORD), San Diego (SAN), San Francisco (SFO), and Teterboro (TEB). Delay programme types included one ground stop, four ground delay programmes, two airport closures, and four general arrival/departure delay advisories. A ground stop holds departures bound for an airport on the ground at their origin, while a ground delay programme meters arrivals by assigning later departure times.
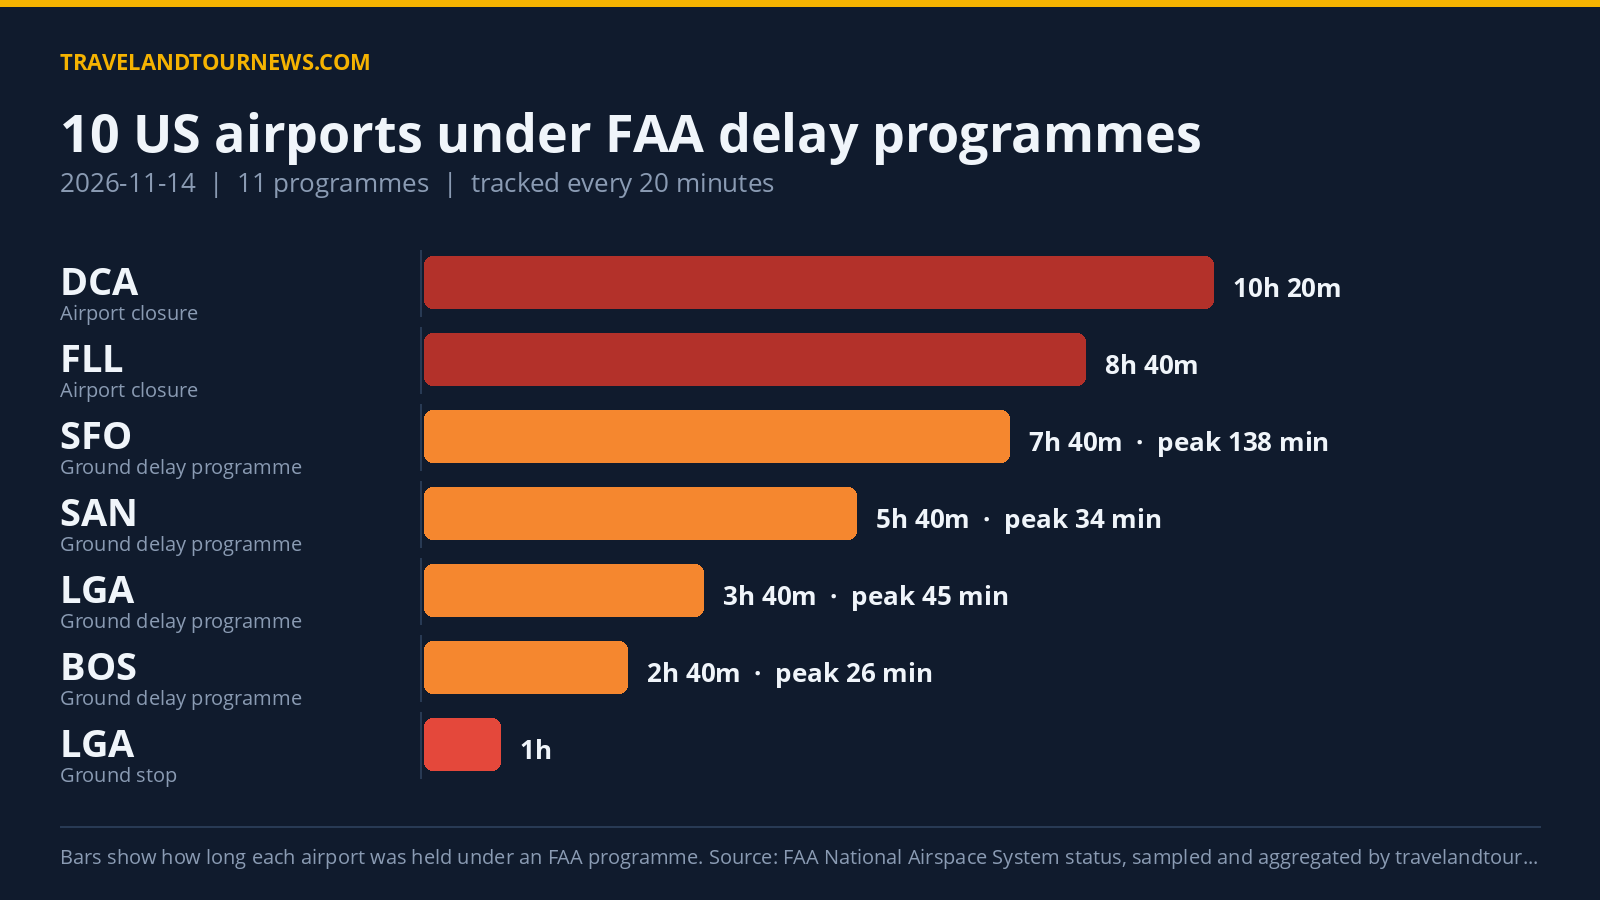
LaGuardia’s ground stop lasted for one hour from 21:20 to 22:20 UTC with no recorded average or maximum delay in minutes, attributed
to nonspecific causes classified simply as “other.” Meanwhile, San Francisco International (SFO) carried a ground delay programme for 7 hours 40 minutes, driven by wind, with peak average delays of 138 minutes and maximum delays reaching up to 690 minutes. LaGuardia also had a separate ground delay programme lasting 3 hours 40 minutes early in the day with wind as the cause and peak average delay of 45 minutes.
San Diego and Boston experienced ground delay programmes primarily due to airport volume constraints, lasting 5 hours 40 minutes and 2 hours 40 minutes respectively. Their peak average delays were 34
minutes (SAN) and 26 minutes (BOS). Airport closures were enforced at Ronald Reagan Washington National for 10 hours 20 minutes and at Fort Lauderdale for 8 hours 40 minutes, both due to restrictions on diversions related to capacity and management. The remaining four general delay advisories covered Chicago O’Hare, Atlanta, Houston Intercontinental, and Teterboro with peak average delays ranging from 16 to 301 minutes.
| Airport | FAA programme | Cause | Peak average delay | In force (UTC) |
|---|---|---|---|---|
| LaGuardia (LGA) | Ground Stop Programs | other | – | 21:20 to 22:20 (1 hour) |
| San Francisco International (SFO) | Ground Delay Programs | wind | 138 min | 00:00 to 07:40 (7 hours 40 minutes) |
| LaGuardia (LGA) | Ground Delay Programs | wind | 45 min | 00:00 to 03:40 (3 hours 40 minutes) |
| San Diego International (SAN) | Ground Delay Programs | airport volume | 34 min | 00:00 to 05:40 (5 hours 40 minutes) |
| Boston Logan International (BOS) | Ground Delay Programs | airport volume | 26 min | 00:00 to 02:40 (2 hours 40 minutes) |
| Ronald Reagan Washington National (DCA) | Airport Closures | airport closed to diversion aircraft | – | 00:20 to 10:40 (10 hours 20 minutes) |
| Fort Lauderdale-Hollywood International (FLL) | Airport Closures | airport closed to diversion aircraft due to capacity ctc ap management; airport closed to diversion aircraft due to capacity | – | 00:00 to 08:40 (8 hours 40 minutes) |
| Chicago O’Hare International (ORD) | General Arrival/Departure Delay Info | EQ:FAA | 301 min | 01:20 to 01:20 (20 minutes) |
| Hartsfield-Jackson Atlanta International (ATL) | General Arrival/Departure Delay Info | OTHER: NATIONAL STOP | 181 min | 01:00 to 01:20 (20 minutes) |
| George Bush Intercontinental (IAH) | General Arrival/Departure Delay Info | TM Initiatives:STOP:EQ | 150 min | 00:00 to 00:00 (20 minutes) |
| TEB | General Arrival/Departure Delay Info | VOL:Volume | 16 min | 13:40 to 13:40 (20 minutes) |
Wind and Diversion Restrictions Were Leading Causes
The FAA cited wind as the top cause among the delay programmes, appearing 36 times in the data. Restrictions on diversion aircraft, either due to airport closures or capacity management, were the next leading causes, with
32 and 24 mentions respectively. Airport volume was also a significant factor, driving 27 delay programmes. Causes categorized as “other” appeared only four times across the dataset.
Comparison With Recent Data
Compared with the previous day, which had 22 airports affected and 34 total programmes, today’s figures represent a reduction of 12 programmes affecting fewer airports. The seven-day average for airports affected is 13.1, making today’s 10 airports below this recent average. November 14, 2026, was not the worst day within the tracking window for these delay metrics.
Methodology. travelandtournews.com samples the FAA’s National Airspace System status feed every 20 minutes throughout the US
operating day and aggregates the result. This report is built from 68 samples taken between 00:00 and 22:20 UTC on 2026-11-14. Durations are the observed window between the first and last sample in which a programme was in force, so a programme’s true length may be slightly longer than shown. Ground stops, ground delay programmes, airport closures and general delays are all published by the FAA in real time; the daily aggregation is ours.