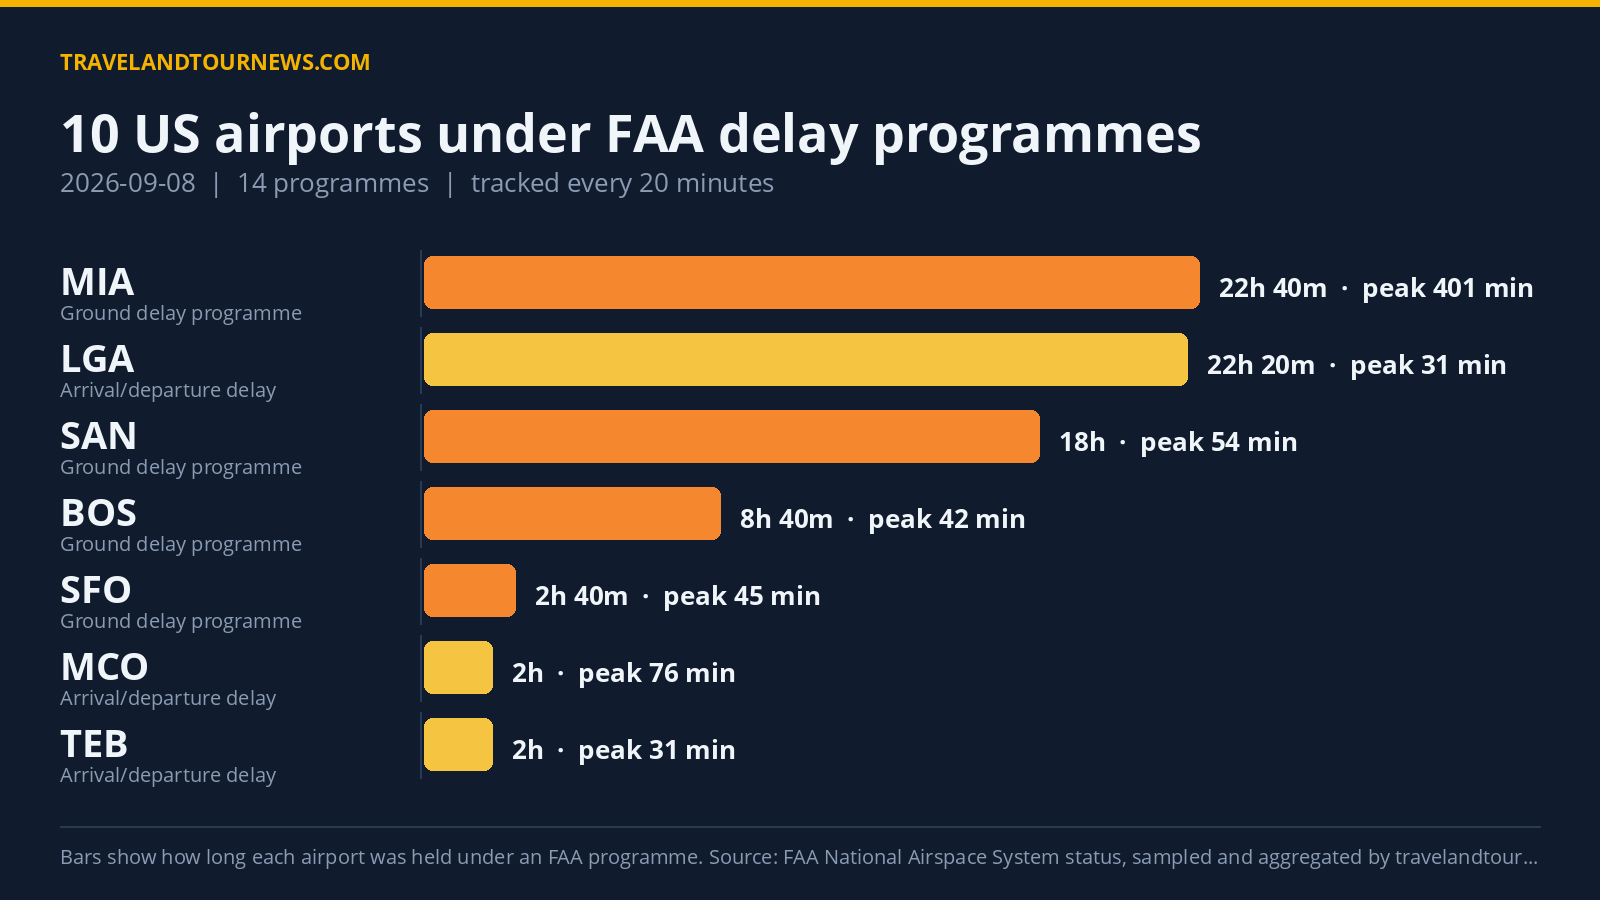

On September 8, 2026, the FAA held delay programmes at 10 airports across the United States, with a total of 14 distinct programmes in effect. The worst-hit airport was Miami International (MIA), which experienced the longest and largest peak delay during a ground delay programme, reaching a maximum delay of 990 minutes.
Delay Programmes by Airport and Type
Among the 14 programmes, there was one Ground Stop Programme and four Ground Delay Programmes; the remaining nine were general arrival and departure delay reports. A ground stop holds departures bound for an airport on the ground at their origin, while a ground delay programme meters arrivals by assigning later departure times.
The single ground stop was at San Francisco International (SFO) from 01:20 to 01:40 UTC due to airport volume, lasting 20 minutes but with no recorded delay minutes.
Four airports had ground delay programmes of varying lengths: MIA operated under this type for 22 hours 40 minutes (00:00
to 22:40 UTC) with peak average and maximum delays of 401 and 990 minutes respectively caused by thunderstorms and a disabled aircraft on the runway. San Diego International (SAN) ran one for 18 hours due to airport volume, posting peak delays of 54 average and 323 maximum minutes. SFO also had a ground delay programme later in the day for 2 hours 40 minutes with delays peaking at 45 average minutes and 94 maximum minutes. Boston Logan International (BOS) had an 8 hour 40 minute ground delay programme for runway construction with peak delays of 42 and 119 minutes.
The
general arrival and departure delay reports appeared for airports including Orlando International (MCO), LaGuardia (LGA), TEB, Newark Liberty International (EWR), Dallas Love Field (DAL), Phoenix Sky Harbor (PHX), and additional reports at BOS, SAN, and SFO, with durations ranging from 20 minutes to over 22 hours and peak delays between 16 and 76 minutes.
| Airport | FAA programme | Cause | Peak average delay | In force (UTC) |
|---|---|---|---|---|
| San Francisco International (SFO) | Ground Stop Programs | airport volume | – | 01:20 to 01:40 (20 minutes) |
| Miami International (MIA) | Ground Delay Programs | thunderstorms; disabled aircraft on the runway | 401 min | 00:00 to 22:40 (22 hours 40 minutes) |
| San Diego International (SAN) | Ground Delay Programs | airport volume | 54 min | 00:00 to 18:00 (18 hours) |
| San Francisco International (SFO) | Ground Delay Programs | airport volume | 45 min | 02:00 to 04:40 (2 hours 40 minutes) |
| Boston Logan International (BOS) | Ground Delay Programs | runway construction | 42 min | 14:00 to 22:40 (8 hours 40 minutes) |
| Orlando International (MCO) | General Arrival/Departure Delay Info | WX:Thunderstorms | 76 min | 00:00 to 02:00 (2 hours) |
| LaGuardia (LGA) | General Arrival/Departure Delay Info | WX:Wind | 31 min | 00:00 to 22:20 (22 hours 20 minutes) |
| TEB | General Arrival/Departure Delay Info | VOL:Volume | 31 min | 00:00 to 02:00 (2 hours) |
| Newark Liberty International (EWR) | General Arrival/Departure Delay Info | TM Initiatives:STOP:WHITE; TM INITIATIVES:STOP:WHITE | 31 min | 15:00 to 15:20 (20 minutes) |
| San Francisco International (SFO) | General Arrival/Departure Delay Info | RWY:Construction | 16 min | 00:00 to 02:00 (2 hours) |
| San Diego International (SAN) | General Arrival/Departure Delay Info | VOL:Compacted Demand | 16 min | 00:40 to 01:40 (1 hour) |
| Dallas Love Field (DAL) | General Arrival/Departure Delay Info | WX:Thunderstorms | 16 min | 00:20 to 00:20 (20 minutes) |
| Phoenix Sky Harbor International (PHX) | General Arrival/Departure Delay Info | VOL:Multi-taxi | 16 min | 16:40 to 17:00 (20 minutes) |
| Boston Logan International (BOS) | General Arrival/Departure Delay Info | RWY:Construction | 16 min | 22:20 to 22:40 (20 minutes) |
Causes of Delay Programmes
Delays were largely driven by a set of key causes identified by the FAA. The most frequent cause was airport volume, responsible for 40 programmes or samples. Disabled aircraft on the runway accounted for 25, while runway construction caused 15.
When combined, runway construction-related causes including
the RWY:Construction code contributed to a total of 24 samples. Weather-related causes such as thunderstorms and wind accounted for 8 to 16 samples depending on coding specifics—thunderstorms affected MIA and other airports, while wind delays appeared notably at LaGuardia.
Less frequent causes included TM Initiatives at Newark and volume management codes such as VOL:Volume, VOL:Compacted Demand, and VOL:Multi-taxi.
Comparing September 8 to Recent Performance
Compared to the previous day, September 7, 2026, the number of airports affected by delay programmes decreased from 16 to 10, a decline of 6 airports under delay programmes. The total number of programmes declined from 24 to 14.
In relation to
the seven-day average of 18.7 airports affected, this day represents a reduction in the number of airports under delay programmes. The day was not the worst in this tracking window for either airports affected or total programmes.
Methodology. travelandtournews.com samples the FAA’s National Airspace System status feed every 20 minutes throughout the US operating day and aggregates the result. This report is built from 57 samples taken between 00:00 and 22:40 UTC on 2026-09-08. Durations are the observed window between the first and last sample in which a programme was in force, so a programme’s true length may be slightly
longer than shown. Ground stops, ground delay programmes, airport closures and general delays are all published by the FAA in real time; the daily aggregation is ours.