
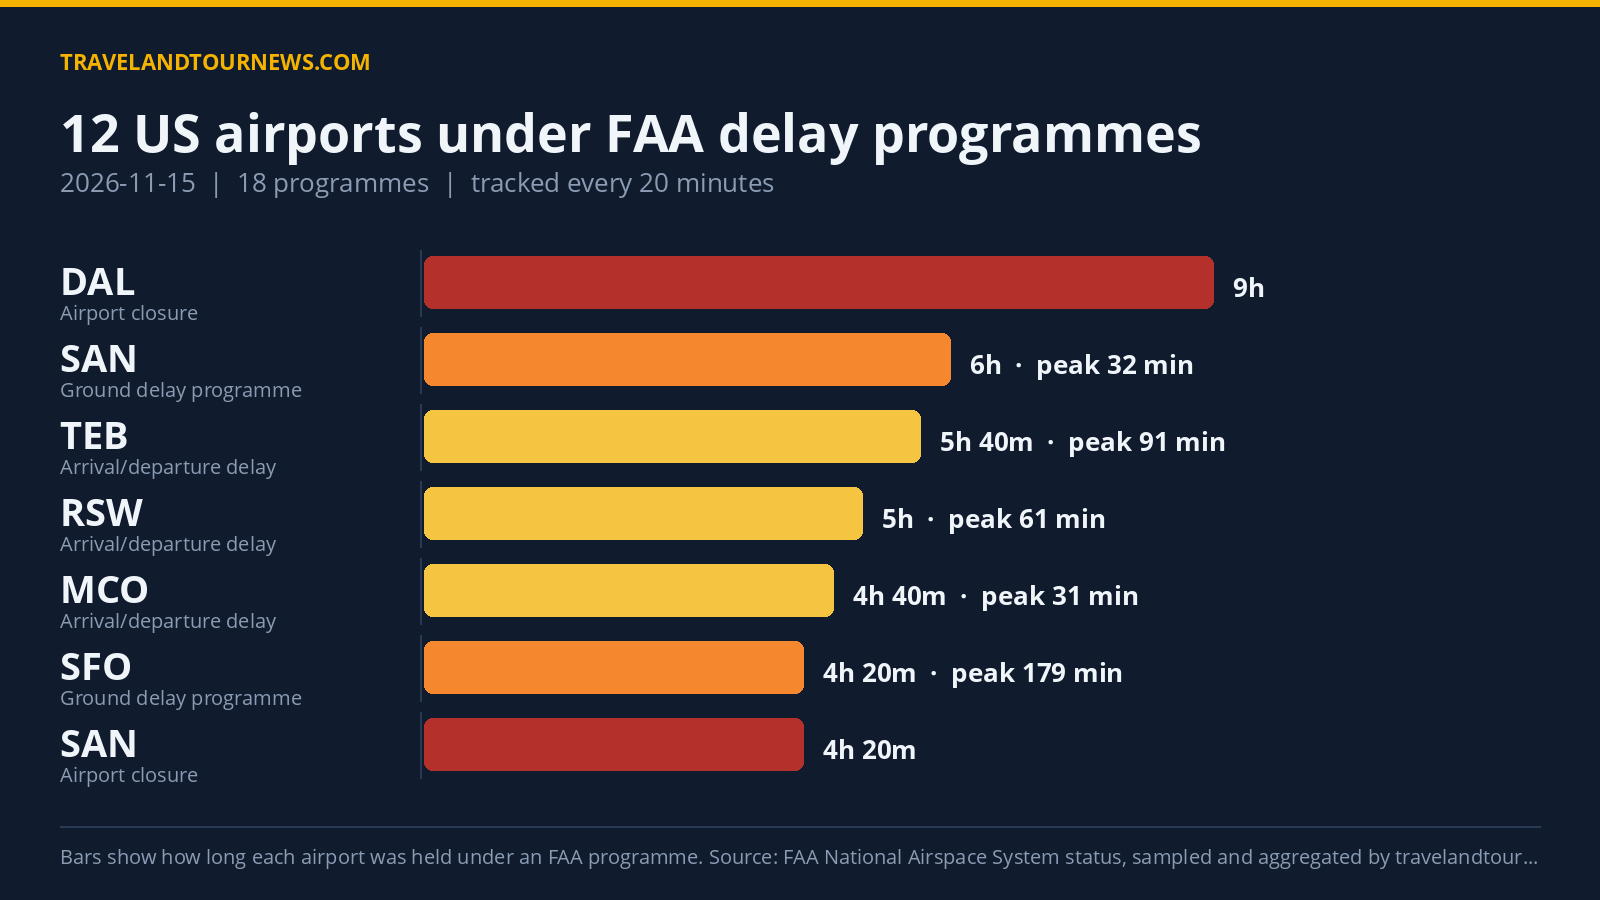

On November 15, 2026, the FAA held 12 airports across the United States under 18 active delay programs. The worst-hit airport was San Francisco International (SFO), experiencing a peak average delay of 179 minutes and a peak maximum delay of 341 minutes during ground delay programs related to low ceilings and wind.
Delay Program Overview Across 12 Airports
The 12 airports affected were AUS, DAL, DJT, FLL, FMY, MCO, MIA, OPF, RSW, SAN, SFO, and TEB. The FAA issued four Ground Stop Programs, four Ground Delay Programs, two Airport Closures, and eight General Arrival/Departure Delay Info advisories.
A ground stop holds departures bound for an airport on the ground at their origin, while a ground delay program meters arrivals by assigning later departure times.
Ground stops lasting between 20 minutes and one hour were recorded at AUS (1 hour due to low ceilings), SFO (40 minutes due to wind), DAL (40 minutes due to low ceilings), and MCO
(20 minutes due to an aircraft emergency). Ground delay programs were longer, including San Francisco International’s 4 hours 20 minutes and San Diego International’s 6 hours due to airport volume.
Airport closures were recorded at Dallas Love Field, which was closed for 9 hours, and San Diego International, closed for 4 hours 20 minutes. General arrival/departure delay notices covered other airports and typically lasted several hours, with OPF and TEB affected for 3 and nearly 6 hours respectively.
| Airport | FAA programme | Cause | Peak average delay | In force (UTC) |
|---|---|---|---|---|
| AUS | Ground Stop Programs | low ceilings | – | 18:00 to 19:00 (1 hour) |
| San Francisco International (SFO) | Ground Stop Programs | wind | – | 18:20 to 19:00 (40 minutes) |
| Dallas Love Field (DAL) | Ground Stop Programs | low ceilings | – | 18:40 to 19:20 (40 minutes) |
| Orlando International (MCO) | Ground Stop Programs | aircraft emergency | – | 21:20 to 21:40 (20 minutes) |
| San Francisco International (SFO) | Ground Delay Programs | low ceilings; wind | 179 min | 18:00 to 22:20 (4 hours 20 minutes) |
| DJT | Ground Delay Programs | runway maintenance | 92 min | 15:20 to 16:40 (1 hour 20 minutes) |
| AUS | Ground Delay Programs | runway construction | 65 min | 19:20 to 22:20 (3 hours) |
| San Diego International (SAN) | Ground Delay Programs | airport volume | 32 min | 16:20 to 22:20 (6 hours) |
| Dallas Love Field (DAL) | Airport Closures | airport closed | – | 02:40 to 11:40 (9 hours) |
| San Diego International (SAN) | Airport Closures | airport closed | – | 09:20 to 13:40 (4 hours 20 minutes) |
| FMY | General Arrival/Departure Delay Info | OTHER:ZJX | 121 min | 19:00 to 22:20 (3 hours 20 minutes) |
| OPF | General Arrival/Departure Delay Info | TM Initiatives:STOP:VOL; TM Initiatives:Other:ROCKET LAUNCH; TM INITIATIVES:OTHER:ROCKET LAUNCH | 121 min | 17:20 to 20:20 (3 hours) |
| TEB | General Arrival/Departure Delay Info | TM Initiatives:Metering:VOL; TM Initiatives:Metering:ROCKET LAUNCH; VOL:Volume | 91 min | 16:40 to 22:20 (5 hours 40 minutes) |
| Fort Lauderdale-Hollywood International (FLL) | General Arrival/Departure Delay Info | TM Initiatives:MIT:ROCKET LAUNCH; TM INITIATIVES:MIT:ROCKET LAUNCH | 91 min | 16:20 to 19:20 (3 hours) |
Leading Causes of Delays and Closures
Across all programs, “airport closed” led as the reason with 42 mentions, mostly linked to the closures at Dallas Love Field and
San Diego International. The second most frequent cause was “airport volume,” noted 19 times, primarily affecting San Diego and TEB.
Traffic management initiatives related to rocket launches appeared 18 times as a significant disruption factor at airports including Fort Lauderdale-Hollywood International, Miami International, OPF, and TEB.
Other prevalent causes included volume congestion in the Florida and Jacksonville areas indicated as VOL:ZJX (16 times), and wind conditions negatively impacting SFO (13 mentions).
Comparison to Previous Day and Recent Average
Compared to the previous day, when 10 airports were affected by 11 delay programs, November 15 saw an increase of two airports and seven more programs. This day’s 12
airports affected matches closely the recent seven-day average of 12.9 airports, indicating a normal level of operational disruptions. The current delay figures are not the worst in the recent window analyzed.
Methodology. travelandtournews.com samples the FAA’s National Airspace System status feed every 20 minutes throughout the US operating day and aggregates the result. This report is built from 68 samples taken between 00:00 and 22:20 UTC on 2026-11-15. Durations are the observed window between the first and last sample in which a programme was in force, so a programme’s true length may be slightly longer than shown. Ground stops, ground
delay programmes, airport closures and general delays are all published by the FAA in real time; the daily aggregation is ours.