
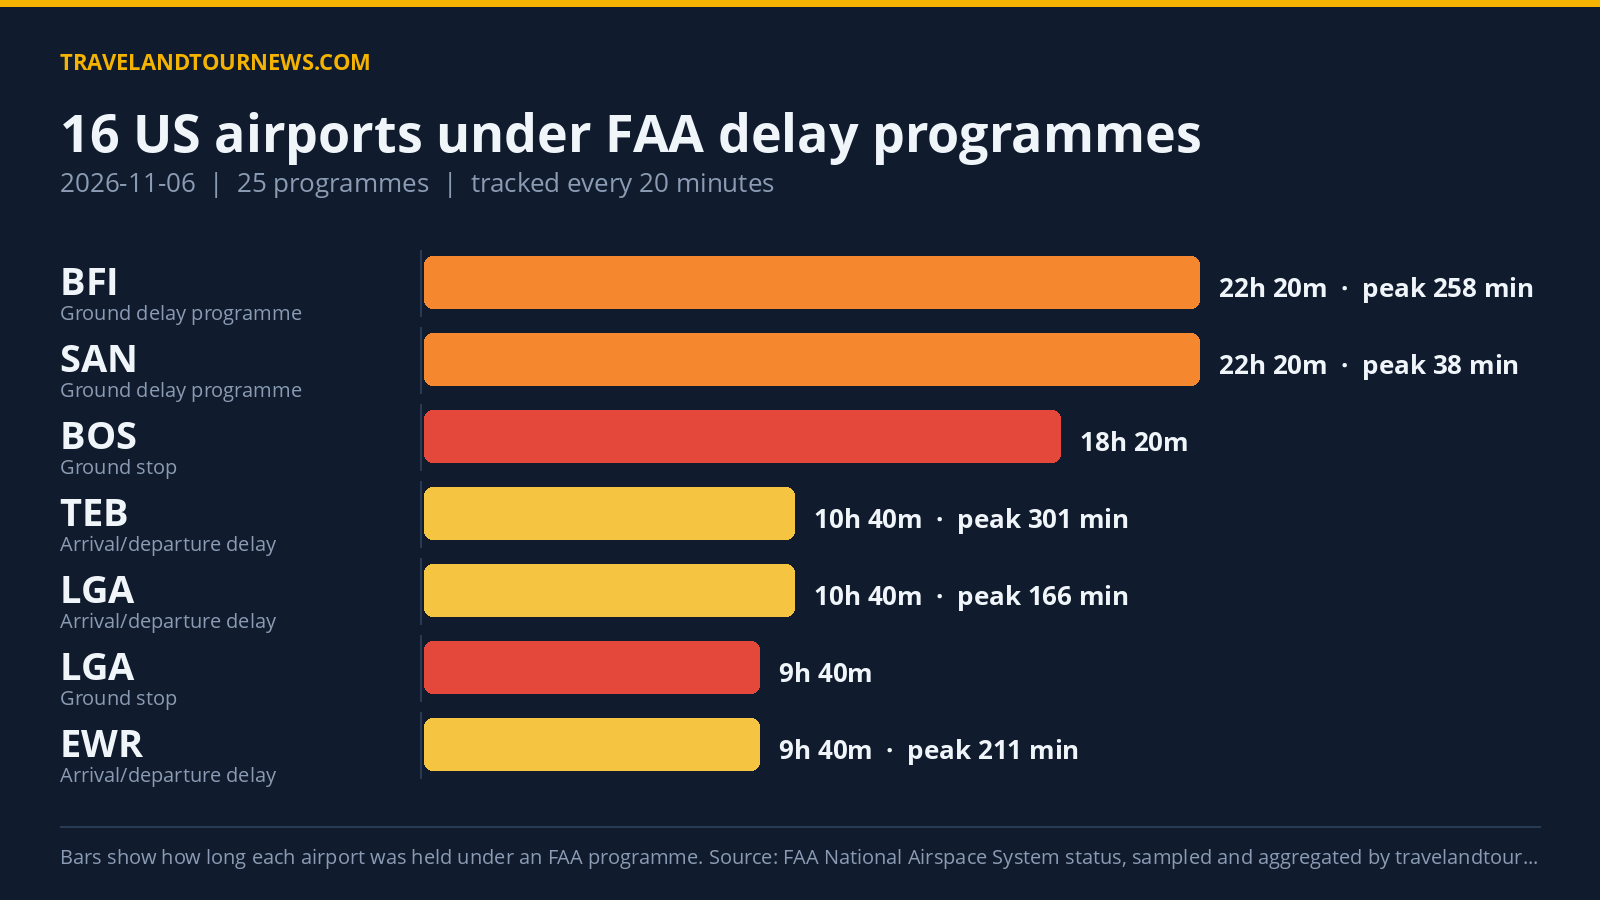

On November 6, 2026, the FAA held 16 US airports under 25 active delay programs. Boston Logan International Airport (BOS) was the worst-hit airport, affected by ground stop and ground delay programs with peak delays reaching up to 728 minutes.
Delay Programs Active Across 16 US Airports
The FAA implemented 6 Ground Stop Programs, which prevent departures bound for affected airports, and 5 Ground Delay Programs that meter arrivals by assigning later departure times. Additionally, 14 General Arrival/Departure Delay Information notices were active across the country.
Boston Logan International (BOS) experienced the longest ground stop program, active from midnight until 18:20 UTC, lasting 18 hours and 20 minutes. This was accompanied by a 7-hour ground delay program extending into the evening. Peak delays at BOS reached a maximum of 728 minutes, though average delays in ground stops remained at zero. Other major airports with ground stops related
to thunderstorms included LaGuardia (LGA) for 9 hours and 40 minutes, JFK for 8 hours, Newark Liberty (EWR) for 7 hours, and HPN for 40 minutes.
Ground delay programs were also significant at LaGuardia for 9 hours, Newark Liberty for 5 hours, and Boston Logan for 7 hours, each driven primarily by thunderstorms. Seattle, San Diego (SAN), and Boeing Field (BFI) also had extensive ground delay programs, with SAN’s lasting 22 hours and 20 minutes due to airport volume.
| Airport | FAA programme | Cause | Peak average delay | In force (UTC) |
|---|---|---|---|---|
| Boston Logan International (BOS) | Ground Stop Programs | airspace volume; thunderstorms | – | 00:00 to 18:20 (18 hours 20 minutes) |
| LaGuardia (LGA) | Ground Stop Programs | thunderstorms | – | 12:00 to 21:40 (9 hours 40 minutes) |
| John F. Kennedy International (JFK) | Ground Stop Programs | thunderstorms | – | 11:20 to 19:20 (8 hours) |
| Newark Liberty International (EWR) | Ground Stop Programs | thunderstorms | – | 13:40 to 20:40 (7 hours) |
| HPN | Ground Stop Programs | thunderstorms | – | 21:00 to 21:40 (40 minutes) |
| BFI | Ground Stop Programs | other | – | 19:00 to 19:20 (20 minutes) |
| BFI | Ground Delay Programs | other | 258 min | 00:00 to 22:20 (22 hours 20 minutes) |
| LaGuardia (LGA) | Ground Delay Programs | thunderstorms | 174 min | 13:20 to 22:20 (9 hours) |
| Newark Liberty International (EWR) | Ground Delay Programs | thunderstorms | 156 min | 17:20 to 22:20 (5 hours) |
| Boston Logan International (BOS) | Ground Delay Programs | thunderstorms | 144 min | 15:20 to 22:20 (7 hours) |
| San Diego International (SAN) | Ground Delay Programs | airport volume | 38 min | 00:00 to 22:20 (22 hours 20 minutes) |
| TEB | General Arrival/Departure Delay Info | TM Initiatives:SWAP:WX | 301 min | 11:40 to 22:20 (10 hours 40 minutes) |
| Philadelphia International (PHL) | General Arrival/Departure Delay Info | TM Initiatives:SWAP:WX | 256 min | 14:00 to 21:20 (7 hours 20 minutes) |
| Newark Liberty International (EWR) | General Arrival/Departure Delay Info | TM Initiatives:SWAP:WX | 211 min | 12:40 to 22:20 (9 hours 40 minutes) |
Thunderstorms and Airspace Volume Were Leading Delay Drivers
Thunderstorms were the predominant cause driving FAA delay programs on this date, appearing as a reason in multiple airports’ ground stops
and delay programs. The FAA categorized these disruptions under both direct thunderstorm impacts and combined weather-airspace initiatives.
The top cited cause was “TM Initiatives:SWAP:WX,” related to weather-related traffic management, with 170 program samples logged. Thunderstorm-specific delays accounted for 131 program instances. Airport volume issues appeared in 33 programs, notably at San Diego International. Other causes included “other” reasons and compounding weather categories cited by the FAA.
Comparison to Previous Day and Weekly Average
Compared to November 5, yesterday, the number of airports under delay programs increased from 10 to 16, with total programs rising from 12 to 25. This reflects an increase of 6 airports and more
than double the programs in force. The 16 airports affected also exceed the weekly seven-day average of 11.6 airports, although November 6 was not the worst day in the recent tracking window.
Methodology. travelandtournews.com samples the FAA’s National Airspace System status feed every 20 minutes throughout the US operating day and aggregates the result. This report is built from 67 samples taken between 00:00 and 22:20 UTC on 2026-11-06. Durations are the observed window between the first and last sample in which a programme was in force, so a programme’s true length may be slightly longer than shown. Ground stops,
ground delay programmes, airport closures and general delays are all published by the FAA in real time; the daily aggregation is ours.