
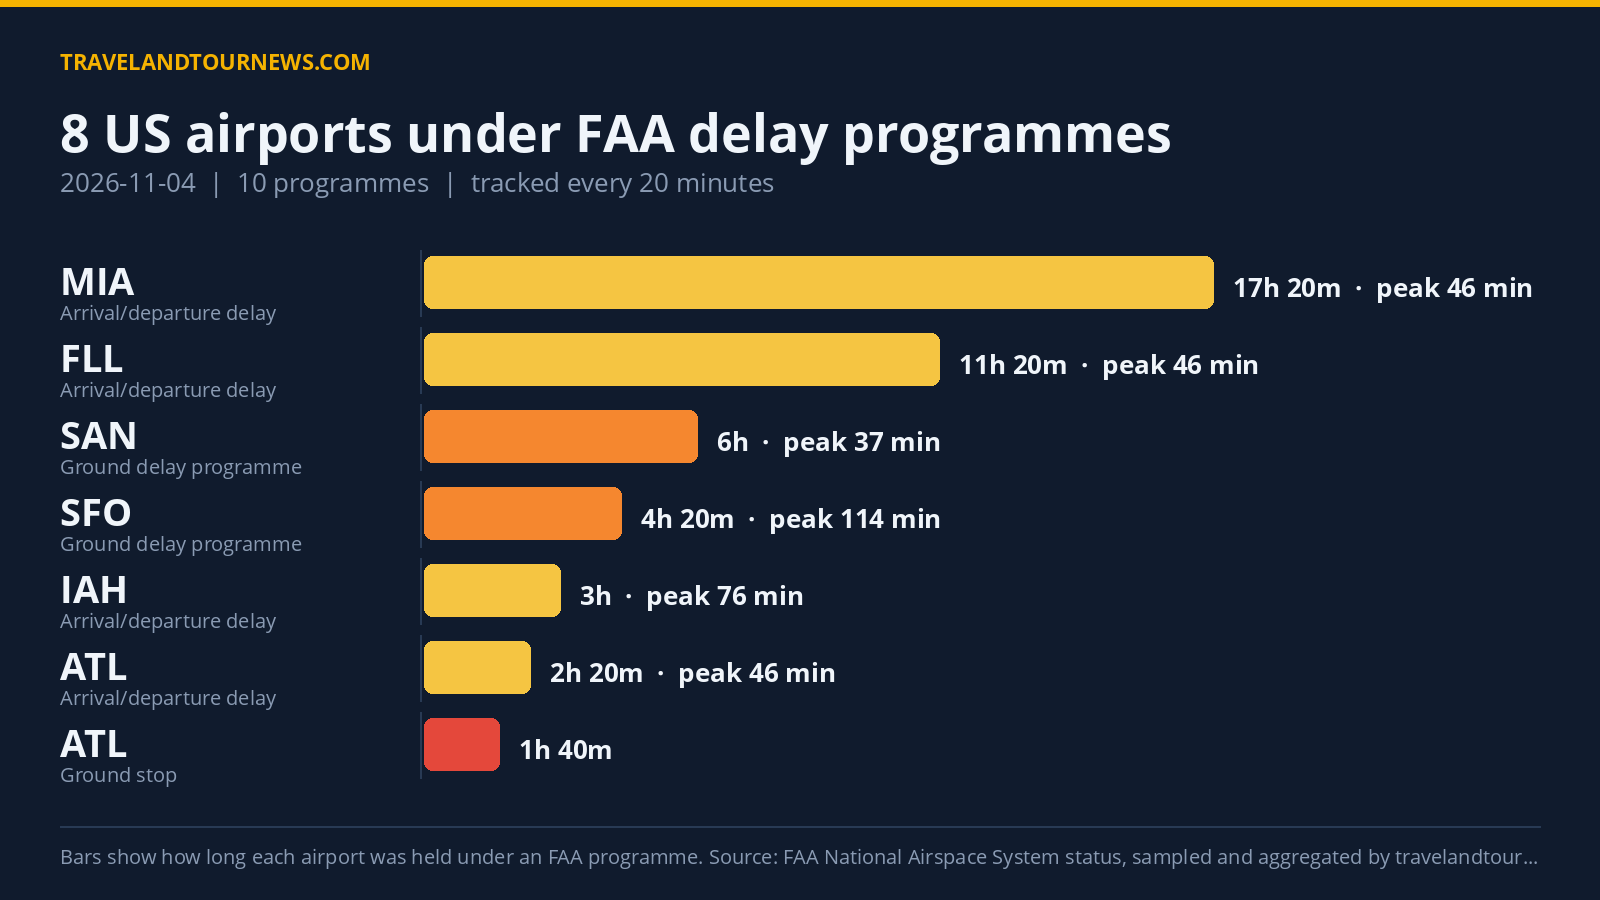

On November 4, 2026, the FAA held eight airports across the United States under delay programs totaling 10 distinct initiatives. The worst-hit airport was San Francisco International (SFO), where a ground delay program caused a peak maximum delay of 519 minutes.
Details of Delay Programs at US Airports
Eight airports experienced delay programs on this date: Hartsfield-Jackson Atlanta International (ATL), Fort Lauderdale-Hollywood International (FLL), George Bush Intercontinental (IAH), Miami International (MIA), OPF, San Diego International (SAN), San Francisco International (SFO), and Teterboro Airport (TEB).
The FAA implemented one ground stop program, two ground delay programs, and seven general arrival/departure delay information advisories.
A ground stop holds departures bound for an airport on the ground at their origin, while a ground delay program meters arrivals by assigning later departure times.
At ATL, a ground stop was in force due to thunderstorms for 1 hour and 40 minutes (16:00 to
17:40 UTC) with no reported peak delays but observed over five samples. In addition, general arrival/departure delay programs at ATL due to thunderstorms lasted 2 hours and 20 minutes with peak average delays of 46 minutes and maximum delays of 60 minutes.
San Francisco International Airport (SFO) had a ground delay program related to wind affecting operations for 4 hours and 20 minutes starting at midnight UTC. This program produced the highest observed peak average delay of 114 minutes and the maximum delay reported was 519 minutes.
San Diego International (SAN) saw two distinct delay programs. A ground delay program
caused by airport volume lasted 6 hours, from 15:00 to 21:00 UTC, with a peak average delay of 37 minutes and a maximum of 71 minutes. Later, a general delay program citing volume lasted 20 minutes with peak delays up to 30 minutes.
George Bush Intercontinental (IAH) had a general arrival/departure delay program due to thunderstorms lasting 3 hours with peak average delays of 76 minutes and a maximum of 90 minutes.
Miami International (MIA) reported the longest observed duration in general delay programs spanning 17 hours and 20 minutes. The causes combined management initiatives related to weather and thunderstorms,
with peak average delays of 46 minutes and maximum delays of 60 minutes.
Fort Lauderdale-Hollywood International (FLL) also had a general delay advisory lasting 11 hours and 20 minutes for management initiatives linked to weather, with peak average delays of 46 minutes and peaks of 60 minutes.
OPF experienced a short 20-minute general delay due to thunderstorms, with peak delays of 16 minutes average and 30 minutes maximum. Teterboro Airport (TEB) had a separate 20-minute general delay program due to staffing issues, where delays averaged 15 minutes and peaked at 29 minutes.
| Airport | FAA programme | Cause | Peak average delay | In force (UTC) |
|---|---|---|---|---|
| Hartsfield-Jackson Atlanta International (ATL) | Ground Stop Programs | thunderstorms | – | 16:00 to 17:40 (1 hour 40 minutes) |
| San Francisco International (SFO) | Ground Delay Programs | wind | 114 min | 00:00 to 04:20 (4 hours 20 minutes) |
| San Diego International (SAN) | Ground Delay Programs | airport volume | 37 min | 15:00 to 21:00 (6 hours) |
| George Bush Intercontinental (IAH) | General Arrival/Departure Delay Info | WX:Thunderstorms | 76 min | 00:00 to 03:00 (3 hours) |
| Miami International (MIA) | General Arrival/Departure Delay Info | TM Initiatives:MIT:WX; WX:Thunderstorms | 46 min | 01:20 to 18:40 (17 hours 20 minutes) |
| Fort Lauderdale-Hollywood International (FLL) | General Arrival/Departure Delay Info | TM Initiatives:MIT:WX | 46 min | 00:40 to 12:00 (11 hours 20 minutes) |
| Hartsfield-Jackson Atlanta International (ATL) | General Arrival/Departure Delay Info | WX:Thunderstorms | 46 min | 16:00 to 18:20 (2 hours 20 minutes) |
| OPF | General Arrival/Departure Delay Info | WX:Thunderstorms | 16 min | 19:40 to 19:40 (20 minutes) |
| San Diego International (SAN) | General Arrival/Departure Delay Info | VOL:Volume | 16 min | 21:40 to 22:00 (20 minutes) |
| TEB | General Arrival/Departure Delay Info | STAFF:Staffing | 15 min | 00:00 to 00:00 (20 minutes) |
Thunderstorms and Weather Were the Leading Causes
The leading cause driving delay programs on November
4 was management initiatives related to weather (listed as “TM Initiatives:MIT:WX”), which appeared 66 times in the dataset across affected airports.
Thunderstorms, including those explicitly noted as “WX:Thunderstorms,” were the second most cited cause with 27 instances. Airport volume and wind were also significant factors behind delays, appearing 19 and 14 times respectively.
Other causes included general thunderstorms listed separately and staffing shortages responsible for shorter delays at specific airports.
Delay Levels and Trends Compared to Previous Days
The total of eight airports affected and 10 delay programs represents a decrease from the prior day, which had 15 airports affected and 22 programs. This marks a reduction of
seven programs compared to yesterday.
This day’s figures are also below the recent seven-day average of 12.1 airports affected, indicating somewhat lower overall disruption relative to typical counts.
The worst delay peak seen at SFO with 519 minutes did not constitute the highest peak in the recent tracking window. The longest observed program duration on this day was 17 hours and 20 minutes at Miami International, although this was under a general delay information program rather than a ground stop or ground delay.
All data are from the FAA National Airspace System status feed, sampled all day by travelandtournews.com.
Methodology.
travelandtournews.com samples the FAA’s National Airspace System status feed every 20 minutes throughout the US operating day and aggregates the result. This report is built from 66 samples taken between 00:00 and 22:00 UTC on 2026-11-04. Durations are the observed window between the first and last sample in which a programme was in force, so a programme’s true length may be slightly longer than shown. Ground stops, ground delay programmes, airport closures and general delays are all published by the FAA in real time; the daily aggregation is ours.