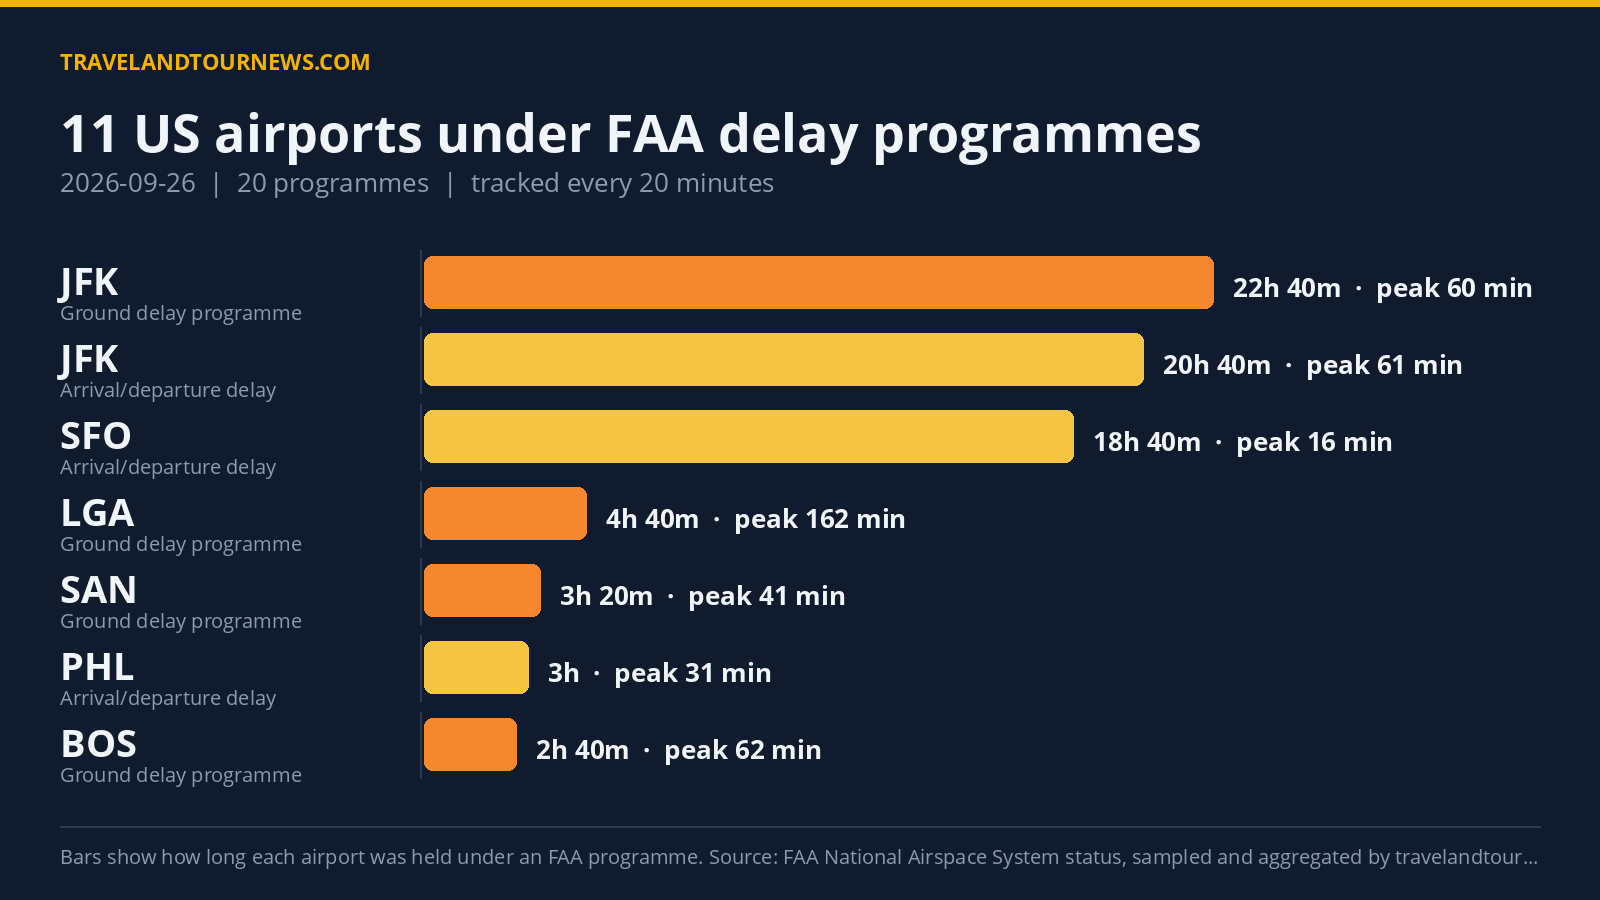

On September 26, 2026, the FAA had delay programmes active at 11 airports across the United States with a total of 20 programmes in effect. The worst-hit airport was LaGuardia (LGA), which recorded the highest peak delay of 263 minutes during a ground delay programme caused by wind.
Airports and Programmes in Force
The FAA imposed seven Ground Stop Programs and seven Ground Delay Programs, alongside six general arrival and departure delay information notices across these airports. Ground Stops temporarily hold departures at their origin airports to control arrivals, while Ground Delay Programmes meter scheduled arrivals by adjusting departure times.
LaGuardia’s wind-driven Ground Delay Program spanned 4 hours and 40 minutes from midnight to 4:40 a.m., producing an average delay peak of 162 minutes and a maximum of 263 minutes. Boston Logan International (BOS) experienced both Ground Stop and Ground Delay Programmes primarily due to wind, with the ground stop lasting 1 hour
and 20 minutes (18:20 to 19:40 UTC) and the ground delay programme occurring later for 2 hours and 40 minutes (20:00 to 22:40 UTC) and reaching a maximum delay of 159 minutes.
Newark Liberty International (EWR) and LaGuardia also had Ground Stop Programs caused by airspace volume, both lasting 80 minutes and 60 minutes respectively. Denver International (DEN) had a Ground Stop due to thunderstorms early in the day for 40 minutes and a separate Ground Delay Program of 20 minutes with a maximum delay of 75 minutes.
Other airports with Ground Delay Programs included Harry Reid International (LAS) for
2 hours and 40 minutes due to other causes, San Diego International (SAN) for 3 hours and 20 minutes due to airport volume, and San Francisco International (SFO) for 2 hours and 40 minutes because of runway construction. JFK had a lengthy 22 hour and 40 minute Ground Delay Program caused by wind with a maximum delay of 108 minutes, and a short Ground Stop early in the day for 20 minutes due to a disabled aircraft on the runway.
| Airport | FAA programme | Cause | Peak average delay | In force (UTC) |
|---|---|---|---|---|
| AHN | Ground Stop Programs | airport volume | – | 14:40 to 16:00 (1 hour 20 minutes) |
| Boston Logan International (BOS) | Ground Stop Programs | wind | – | 18:20 to 19:40 (1 hour 20 minutes) |
| Newark Liberty International (EWR) | Ground Stop Programs | airspace volume | – | 20:00 to 21:20 (1 hour 20 minutes) |
| LaGuardia (LGA) | Ground Stop Programs | airspace volume | – | 20:20 to 21:20 (1 hour) |
| Denver International (DEN) | Ground Stop Programs | thunderstorms | – | 00:00 to 00:40 (40 minutes) |
| John F. Kennedy International (JFK) | Ground Stop Programs | disabled aircraft on the runway | – | 01:20 to 01:40 (20 minutes) |
| Washington Dulles International (IAD) | Ground Stop Programs | air show | – | 19:00 to 19:20 (20 minutes) |
| LaGuardia (LGA) | Ground Delay Programs | wind | 162 min | 00:00 to 04:40 (4 hours 40 minutes) |
| Boston Logan International (BOS) | Ground Delay Programs | WIND | 62 min | 20:00 to 22:40 (2 hours 40 minutes) |
| John F. Kennedy International (JFK) | Ground Delay Programs | wind | 60 min | 00:00 to 22:40 (22 hours 40 minutes) |
| Harry Reid International (LAS) | Ground Delay Programs | other | 53 min | 02:20 to 05:00 (2 hours 40 minutes) |
| San Diego International (SAN) | Ground Delay Programs | airport volume | 41 min | 00:00 to 03:20 (3 hours 20 minutes) |
| San Francisco International (SFO) | Ground Delay Programs | runway construction | 32 min | 00:00 to 02:40 (2 hours 40 minutes) |
| Denver International (DEN) | Ground Delay Programs | thunderstorms | 30 min | 00:00 to 00:20 (20 minutes) |
General arrival and departure delay information was issued at JFK, Boston Logan, Denver, Philadelphia International (PHL), San Francisco, and LaGuardia, covering a broad range of reasons including disabled aircraft on runways, wildlife presence, staffing issues, and wind-related weather impacts.
Top Causes Behind Delay Programmes
Wind was the leading cause driving the most programmes, recorded as the cause or part of the cause in 36
samples. It appeared across several major hubs, including LaGuardia, Boston Logan, and JFK. Airport volume was the next most frequent reason with 16 samples, affecting airports such as AHN, SAN, and others.
Other significant causes included wind-related weather phenomena (listed separately as WX:Wind) appearing 15 times, runway construction accounting for 9 programmes mostly affecting San Francisco, and miscellaneous other causes also appearing 9 times. Thunderstorms affected Denver during two separate delay programmes. Several ground stops were attributed to airspace volume or special conditions such as an air show at Washington Dulles (IAD) and a disabled aircraft on the runway at
JFK.
Delay Trends Compared to Previous and Average Days
Compared to the previous day, delay activity on September 26 decreased modestly, with four fewer programmes active and four fewer airports affected. Yesterday, 15 airports experienced 23 delay programmes, while today there were 11 airports and 20 programmes.
When compared to a 7-day average of 16 airports affected per day, today’s activity was below average in both the number of programmes and airports impacted. None of September 26’s delay figures represent the worst in the recent tracking window.
Methodology. travelandtournews.com samples the FAA’s National Airspace System status feed every 20 minutes throughout the US operating day and aggregates the
result. This report is built from 69 samples taken between 00:00 and 22:40 UTC on 2026-09-26. Durations are the observed window between the first and last sample in which a programme was in force, so a programme’s true length may be slightly longer than shown. Ground stops, ground delay programmes, airport closures and general delays are all published by the FAA in real time; the daily aggregation is ours.