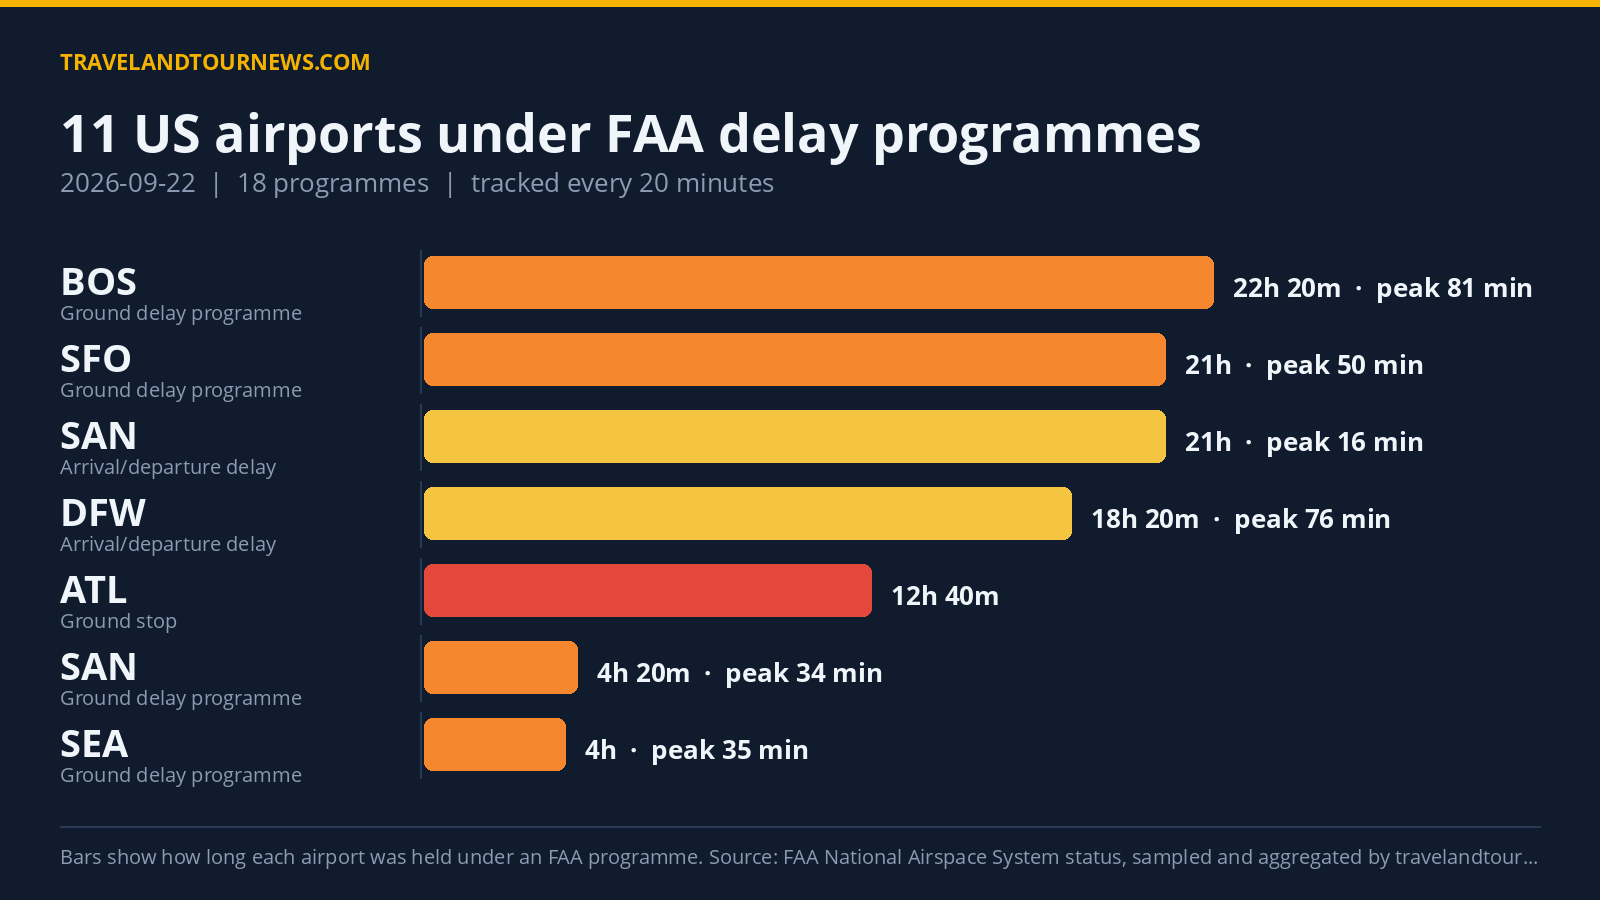

On September 22, 2026, the FAA held 11 airports across the United States under 18 delay programmes. The most affected airport was Dallas/Fort Worth International Airport (DFW), where thunderstorm-driven ground delay programmes caused peak delays reaching 934 minutes.
Airport Delays Across the United States
The 11 airports under delay programmes included Hartsfield-Jackson Atlanta International (ATL), Boston Logan International (BOS), Dallas/Fort Worth International (DFW), LaGuardia (LGA), San Francisco International (SFO), Seattle-Tacoma International (SEA), San Diego International (SAN), Harry Reid International (LAS), Westchester County Airport (HPN), Teterboro Airport (TEB), and Montréal-Pierre Elliott Trudeau International (YUL).
The types of delay programmes recorded were 4 Ground Stop Programmes, 7 Ground Delay Programmes, and 7 General Arrival/Departure Delay Info advisories. A ground stop holds departures at their origin airports bound for the affected airport, while a ground delay programme meters arrivals by assigning later departure times.
Ground stop programmes
lasted from as brief as 20 minutes at HPN to nearly 13 hours at ATL, which was impacted by thunderstorm-related stops for 12 hours 40 minutes. Ground delay programmes showed a wide range of durations, with the longest being a 22-hour 20-minute delay at BOS due to airport volume and runway construction. Peak average delay for the day reached 203 minutes at DFW during its thunderstorm-driven ground delay programme, while the maximum single delay peaked at 934 minutes at the same airport.
| Airport | FAA programme | Cause | Peak average delay | In force (UTC) |
|---|---|---|---|---|
| Hartsfield-Jackson Atlanta International (ATL) | Ground Stop Programs | thunderstorms | – | 00:00 to 12:40 (12 hours 40 minutes) |
| Dallas/Fort Worth International (DFW) | Ground Stop Programs | thunderstorms | – | 00:00 to 01:40 (1 hour 40 minutes) |
| Boston Logan International (BOS) | Ground Stop Programs | runway construction | – | 16:40 to 17:00 (20 minutes) |
| HPN | Ground Stop Programs | equipment outage | – | 20:40 to 20:40 (20 minutes) |
| Dallas/Fort Worth International (DFW) | Ground Delay Programs | thunderstorms | 203 min | 02:00 to 04:20 (2 hours 20 minutes) |
| TEB | Ground Delay Programs | equipment outage | 159 min | 00:00 to 00:00 (20 minutes) |
| Boston Logan International (BOS) | Ground Delay Programs | airport volume; runway construction | 81 min | 00:00 to 22:20 (22 hours 20 minutes) |
| YUL | Ground Delay Programs | other | 59 min | 19:20 to 19:20 (20 minutes) |
| San Francisco International (SFO) | Ground Delay Programs | low ceilings | 50 min | 00:00 to 21:00 (21 hours) |
| Seattle-Tacoma International (SEA) | Ground Delay Programs | runway construction | 35 min | 00:20 to 04:20 (4 hours) |
| San Diego International (SAN) | Ground Delay Programs | airport volume | 34 min | 00:00 to 04:20 (4 hours 20 minutes) |
| Dallas/Fort Worth International (DFW) | General Arrival/Departure Delay Info | WX:Thunderstorms; TM Initiatives:DSP:WX | 76 min | 00:20 to 18:40 (18 hours 20 minutes) |
| Boston Logan International (BOS) | General Arrival/Departure Delay Info | RWY:Construction | 31 min | 22:00 to 22:40 (40 minutes) |
| San Diego International (SAN) | General Arrival/Departure Delay Info | VOL:Compacted Demand | 16 min | 00:00 to 21:00 (21 hours) |
Thunderstorms and Construction Were the Leading Causes
The leading causes reported by the FAA for delay programmes were runway construction, driving 48 samples; low ceilings,
contributing to 38; and airport volume with 20 recorded instances. Thunderstorms played a significant role as well, contributing to 19 samples labeled both as “thunderstorms” and “WX:Thunderstorms” in the FAA data.
Thunderstorms were the sole reason for the longest ground stop at ATL, and also contributed to multiple programmes at DFW and LAS. Runway construction heavily impacted BOS, SEA, and SFO through both ground delay and stop programmes. Equipment outages caused delays at HPN and TEB, while other causes such as traffic management initiatives influenced delays at LGA and DFW.
Delay Trends Compared With Previous Days
The number of airports affected dropped to 11 on September
22, 2026, down from 20 airports affected on the prior day. Similarly, total programmes fell to 18 from 36 the day before, reflecting a decrease of 9 programmes. Against the seven-day average of 17 airports affected, this day saw fewer airports under delay programmes. The data does not indicate this day as the worst in the tracking window.
Methodology. travelandtournews.com samples the FAA’s National Airspace System status feed every 20 minutes throughout the US operating day and aggregates the result. This report is built from 69 samples taken between 00:00 and 22:40 UTC on 2026-09-22. Durations are the observed window
between the first and last sample in which a programme was in force, so a programme’s true length may be slightly longer than shown. Ground stops, ground delay programmes, airport closures and general delays are all published by the FAA in real time; the daily aggregation is ours.