
On September 16, 2026, the FAA held 14 airports across the United States under 17 delay programs, according to data tracked by travelandtournews.com from the FAA National Airspace System status feed. Phoenix Sky Harbor International Airport (PHX) was the worst-hit location, under a ground stop program due to thunderstorms observed for three hours.
Detailed Airport Delay Programs and Durations
Four types of delay programs were recorded: ground stop programs, ground delay programs, and general arrival/departure delay information. A ground stop program holds departures bound for an airport on the ground at their origin, while a ground delay program meters arrivals by assigning later departure times.
Five ground stop programs were active, including at Phoenix (3 hours, thunderstorms), Teterboro (TEB) (40 minutes, airport volume), Austin (AUS) (20 minutes, disabled aircraft on the runway), Harry Reid International (LAS) (20 minutes, airport volume), and Denver (DEN) (20 minutes, other reasons). Peak average and maximum delays for ground stops were recorded as zero
in this dataset.
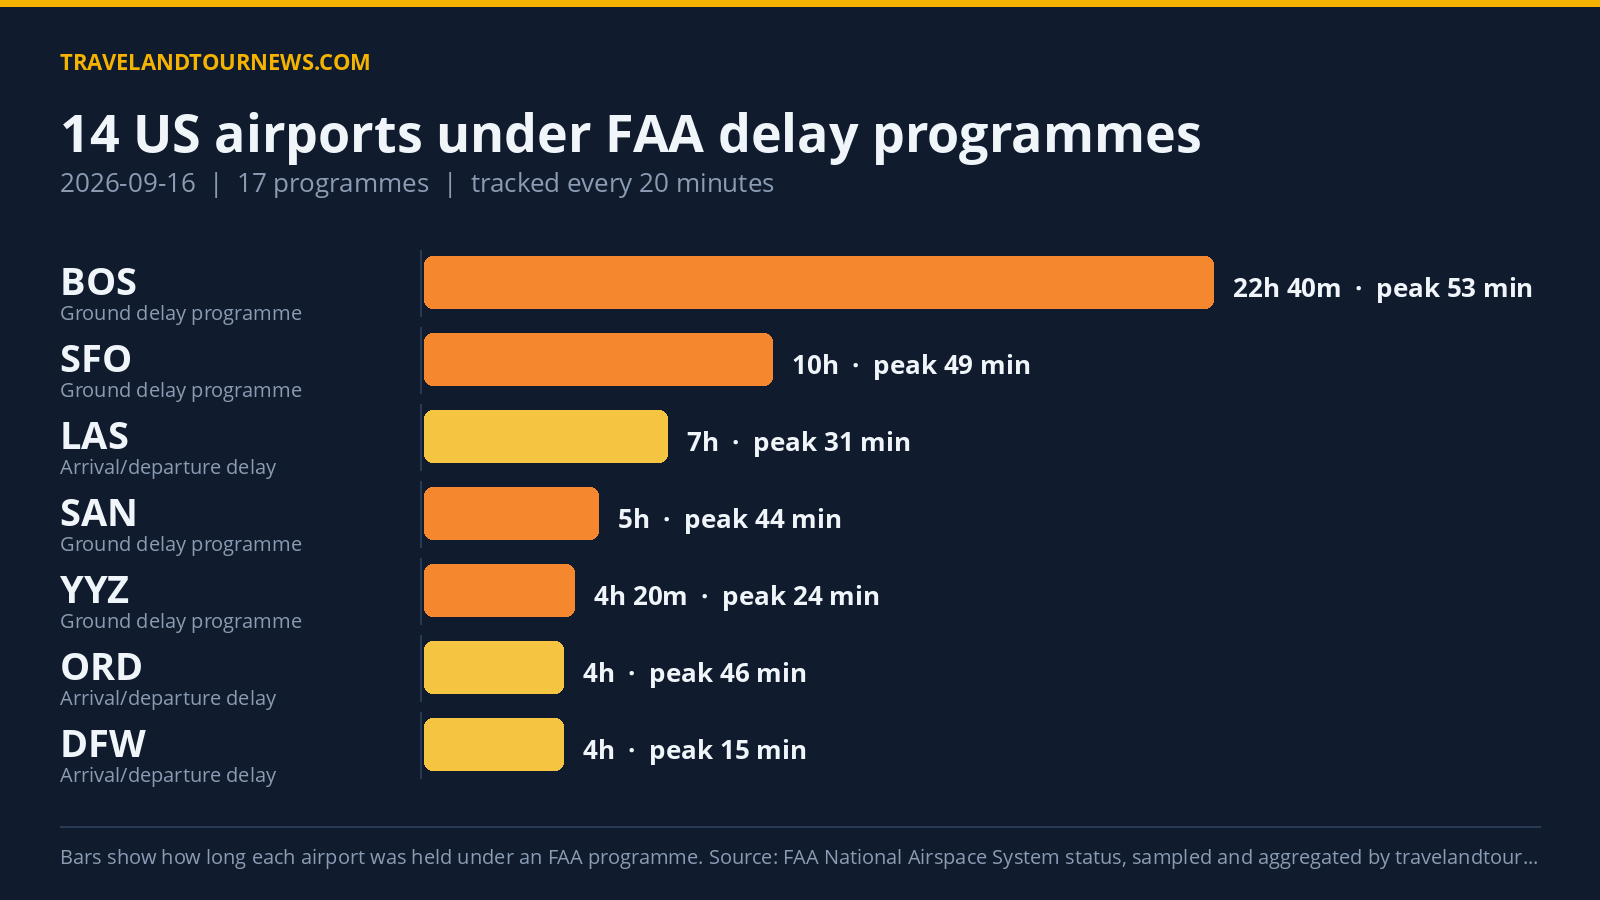
Four ground delay programs operated at Boston Logan International (BOS) for nearly 23 hours combining runway construction and other reasons, San Francisco International (SFO) for 10 hours due to low ceilings, San Diego International (SAN) for 5 hours owing to airport volume, and Toronto Pearson (YYZ) for 4 hours 20 minutes related to airspace volume. BOS peaked with an average delay of 53 minutes and a maximum delay of 210 minutes.
Eight airports reported general arrival/departure delay information driven by factors ranging from volume, weather, and traffic management initiatives. Chicago O’Hare (ORD) and Dallas/Fort Worth (DFW) faced
delays with thunderstorms and volume lasting four hours; Harry Reid International (LAS) experienced wind-related delays lasting seven hours; Phoenix had an additional segment of delays from traffic management initiatives lasting 2 hours 20 minutes.
| Airport | FAA programme | Cause | Peak average delay | In force (UTC) |
|---|---|---|---|---|
| Phoenix Sky Harbor International (PHX) | Ground Stop Programs | thunderstorms | – | 19:20 to 22:20 (3 hours) |
| TEB | Ground Stop Programs | airport volume | – | 20:40 to 21:20 (40 minutes) |
| AUS | Ground Stop Programs | disabled aircraft on the runway | – | 15:00 to 15:00 (20 minutes) |
| Harry Reid International (LAS) | Ground Stop Programs | airport volume | – | 22:20 to 22:20 (20 minutes) |
| Denver International (DEN) | Ground Stop Programs | other | – | 22:40 to 22:40 (20 minutes) |
| Boston Logan International (BOS) | Ground Delay Programs | other; runway construction | 53 min | 00:00 to 22:40 (22 hours 40 minutes) |
| San Francisco International (SFO) | Ground Delay Programs | low ceilings | 49 min | 12:40 to 22:40 (10 hours) |
| San Diego International (SAN) | Ground Delay Programs | airport volume | 44 min | 14:40 to 19:40 (5 hours) |
| YYZ | Ground Delay Programs | airspace volume | 24 min | 16:20 to 20:40 (4 hours 20 minutes) |
| Chicago O’Hare International (ORD) | General Arrival/Departure Delay Info | VOL:Volume; WX:Thunderstorms | 46 min | 00:00 to 04:00 (4 hours) |
| Harry Reid International (LAS) | General Arrival/Departure Delay Info | WX:Wind | 31 min | 15:40 to 22:40 (7 hours) |
| Phoenix Sky Harbor International (PHX) | General Arrival/Departure Delay Info | TM Initiatives:MIT:WX | 31 min | 19:00 to 21:20 (2 hours 20 minutes) |
| TEB | General Arrival/Departure Delay Info | VOL:Volume; TM Initiatives:SWAP:WX | 31 min | 20:40 to 22:40 (2 hours) |
| Ronald Reagan Washington National (DCA) | General Arrival/Departure Delay Info | TM Initiatives:Metering:VOL | 16 min | 20:40 to 20:40 (20 minutes) |
Leading Causes Behind Delay Programs
The top cause behind delay programs on this day was runway construction, cited in 33 samples, primarily affecting Boston Logan International. Thunderstorms ranked second affecting 23 program samples, prominently causing delays at Phoenix, Chicago O’Hare, and Dallas/Fort Worth. Airport volume was cited in 20 samples, impacting multiple airports including San Diego and Teterboro.
Other significant factors included low ceilings (15 samples) affecting San Francisco International, and
airspace volume (14 samples) noted at Toronto Pearson. Weather phenomena such as wind and thunderstorms consistently contributed to delays alongside airports managing high traffic volumes.
Comparison with Previous Day and Recent Averages
The number of affected airports on September 16 remained equal to the previous day at 14, while the total number of delay programs was slightly lower at 17 compared to 20 on the prior day. The seven-day average shows 15.1 airports affected daily, placing this day marginally below recent averages. This day does not mark the highest disruption within the observation window.
Methodology. travelandtournews.com samples the FAA’s National Airspace System status feed every 20 minutes
throughout the US operating day and aggregates the result. This report is built from 69 samples taken between 00:00 and 22:40 UTC on 2026-09-16. Durations are the observed window between the first and last sample in which a programme was in force, so a programme’s true length may be slightly longer than shown. Ground stops, ground delay programmes, airport closures and general delays are all published by the FAA in real time; the daily aggregation is ours.