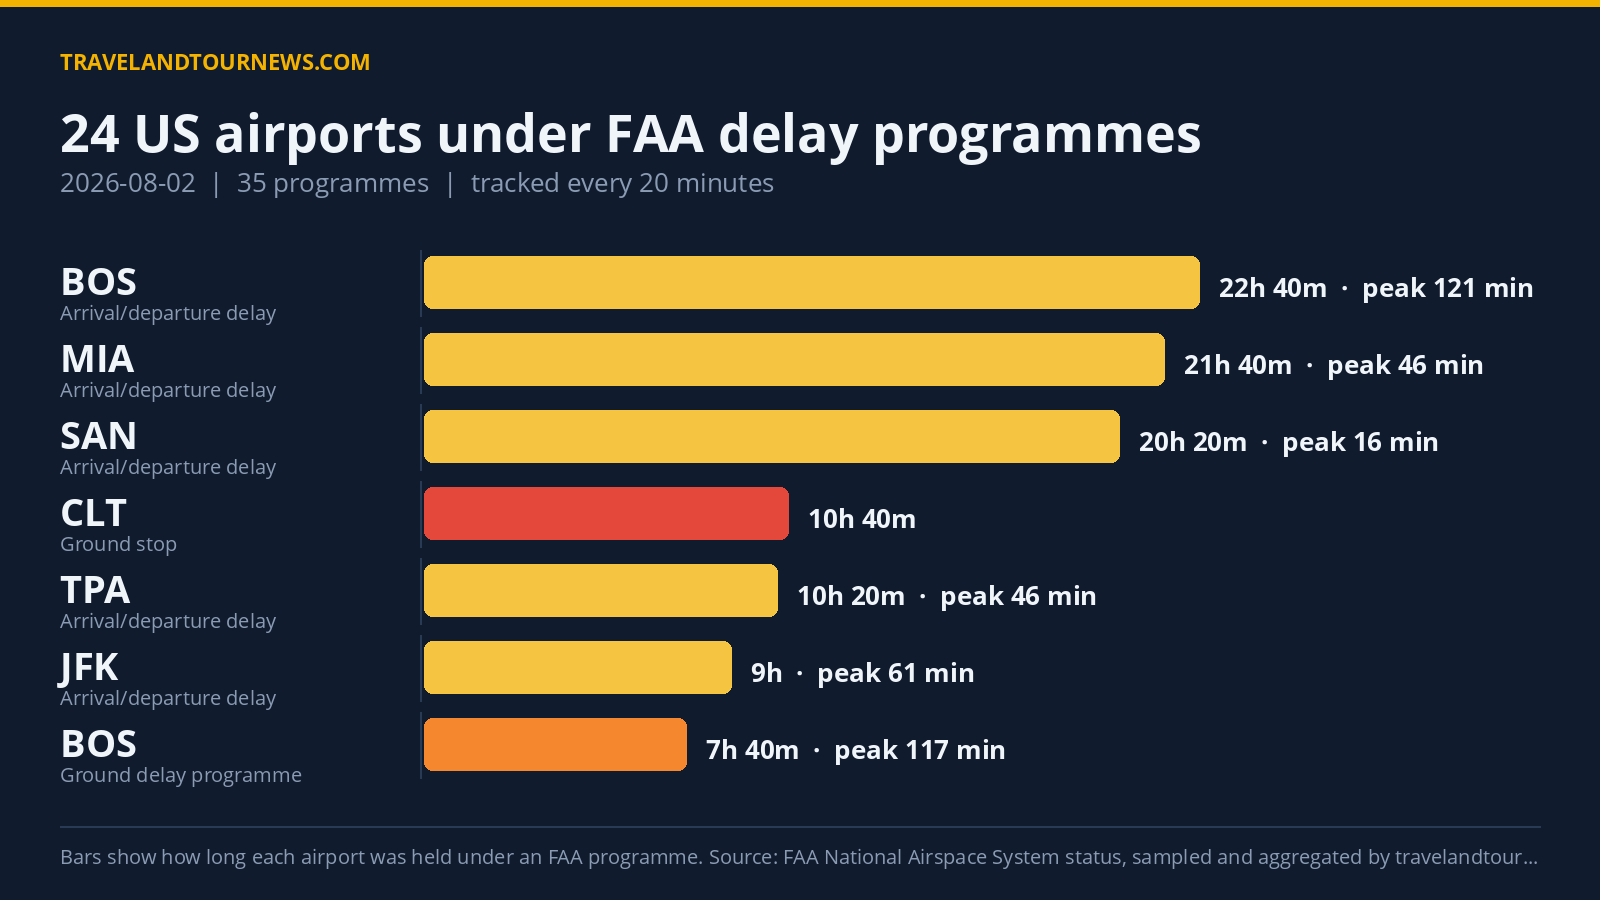

On August 2, 2026, the FAA’s delay programmes impacted 24 airports across the United States with a total of 35 active programmes. The worst-affected airport was Charlotte Douglas International (CLT), which experienced a ground stop program lasting 10 hours and 40 minutes triggered by thunderstorms.
Airports and Programme Types with Duration and Peak Delays
The 24 affected airports included major hubs such as Boston Logan International (BOS), Ronald Reagan Washington National (DCA), Baltimore/Washington International (BWI), Newark Liberty International (EWR), Orlando International (MCO), and San Francisco International (SFO).
Programmes fell into three categories: 10 Ground Stop Programs, 7 Ground Delay Programs, and 18 General Arrival/Departure Delay Info entries. A ground stop holds departures bound for an airport on the ground at their origin, while a ground delay programme meters arrivals by assigning later departure times.
Among the Ground Stop Programs, CLT recorded the longest duration of 640 minutes (10 hours 40 minutes), all due to
thunderstorms. The Washington area airports—DCA, BWI, and IAD—also had ground stops from 200 minutes up to 400 minutes, all weather-related.
Ground Delay Programs were active at BOS for 460 minutes with a peak average delay of 117 minutes and a maximum of 391 minutes due to thunderstorms. DCA’s ground delay lasted 320 minutes with a peak average delay of 80 minutes and a peak maximum delay of 513 minutes. Other airports with ground delays included EWR, PHL, MCO, YUL, and SFO. Notably, SFO saw a ground delay program lasting 280 minutes caused by other reasons besides weather.
General Arrival/Departure Delay
Info programmes lasted as long as 1360 minutes (22 hours 40 minutes) at BOS with peak average delays of 121 minutes driven by wind and thunderstorms. TEB registered a 420-minute general delay info period with peak average delay of 226 minutes linked to traffic management initiatives related to weather.
| Airport | FAA programme | Cause | Peak average delay | In force (UTC) |
|---|---|---|---|---|
| Charlotte Douglas International (CLT) | Ground Stop Programs | thunderstorms | – | 12:00 to 22:40 (10 hours 40 minutes) |
| Ronald Reagan Washington National (DCA) | Ground Stop Programs | thunderstorms | – | 16:00 to 22:40 (6 hours 40 minutes) |
| Baltimore/Washington International (BWI) | Ground Stop Programs | thunderstorms | – | 16:00 to 22:40 (6 hours 40 minutes) |
| Washington Dulles International (IAD) | Ground Stop Programs | thunderstorms | – | 19:20 to 22:40 (3 hours 20 minutes) |
| Boston Logan International (BOS) | Ground Stop Programs | thunderstorms | – | 19:40 to 20:40 (1 hour) |
| Newark Liberty International (EWR) | Ground Stop Programs | thunderstorms | – | 20:00 to 21:00 (1 hour) |
| TEB | Ground Stop Programs | thunderstorms | – | 20:00 to 21:00 (1 hour) |
| LaGuardia (LGA) | Ground Stop Programs | thunderstorms | – | 20:00 to 20:40 (40 minutes) |
| Philadelphia International (PHL) | Ground Stop Programs | thunderstorms | – | 20:40 to 20:40 (20 minutes) |
| AUS | Ground Stop Programs | other | – | 21:20 to 21:40 (20 minutes) |
| Boston Logan International (BOS) | Ground Delay Programs | thunderstorms | 117 min | 15:00 to 22:40 (7 hours 40 minutes) |
| Ronald Reagan Washington National (DCA) | Ground Delay Programs | thunderstorms | 80 min | 17:20 to 22:40 (5 hours 20 minutes) |
| Newark Liberty International (EWR) | Ground Delay Programs | thunderstorms | 59 min | 18:20 to 22:40 (4 hours 20 minutes) |
| Philadelphia International (PHL) | Ground Delay Programs | thunderstorms | 53 min | 21:00 to 22:40 (1 hour 40 minutes) |
Thunderstorms Dominated Delay Causes, Followed by Traffic Management Initiatives
The leading cause behind the FAA delay programmes was thunderstorms, accounting for 137 recorded instances. Secondary causes included Traffic Management initiatives related to weather (TM Initiatives:SWAP:WX) with 84 instances and WX:Thunderstorms cited 59 times separately.
Other causes listed were TM Initiatives:MIT:WX with 38 occurrences and a smaller count of 17 labelled
simply as ‘other.’ Many airports showing ground stops or delays were uniformly affected by thunderstorms, while some general delays involved staffing and volume management factors alongside weather.
Specifically, the worst-hit site CLT experienced only thunderstorm-related ground stops over more than ten hours. The majority of ground stops in the northeastern corridor—BOS, DCA, BWI, EWR, LGA, PHL—were also triggered by thunderstorms. Traffic Management initiatives connected to weather were especially prevalent at TEB and HPN airports.
Delay Volume Rises Slightly from Previous Day but Near Weekly Average
Compared with August 1, 2026, which affected 21 airports with 28 programmes, August 2 showed a slight increase to 24 airports and 35 programmes. This marks
an increase of 3 airports and 7 programmes versus the day prior.
The current level is close to the seven-day average of 20.1 affected airports and indicates consistent activity without reaching the highest in our tracking window. The data shows steady airport impact from delay programmes reflecting ongoing weather challenges and traffic management measures.
Methodology. travelandtournews.com samples the FAA’s National Airspace System status feed every 20 minutes throughout the US operating day and aggregates the result. This report is built from 69 samples taken between 00:00 and 22:40 UTC on 2026-08-02. Durations are the observed window between the first and
last sample in which a programme was in force, so a programme’s true length may be slightly longer than shown. Ground stops, ground delay programmes, airport closures and general delays are all published by the FAA in real time; the daily aggregation is ours.