
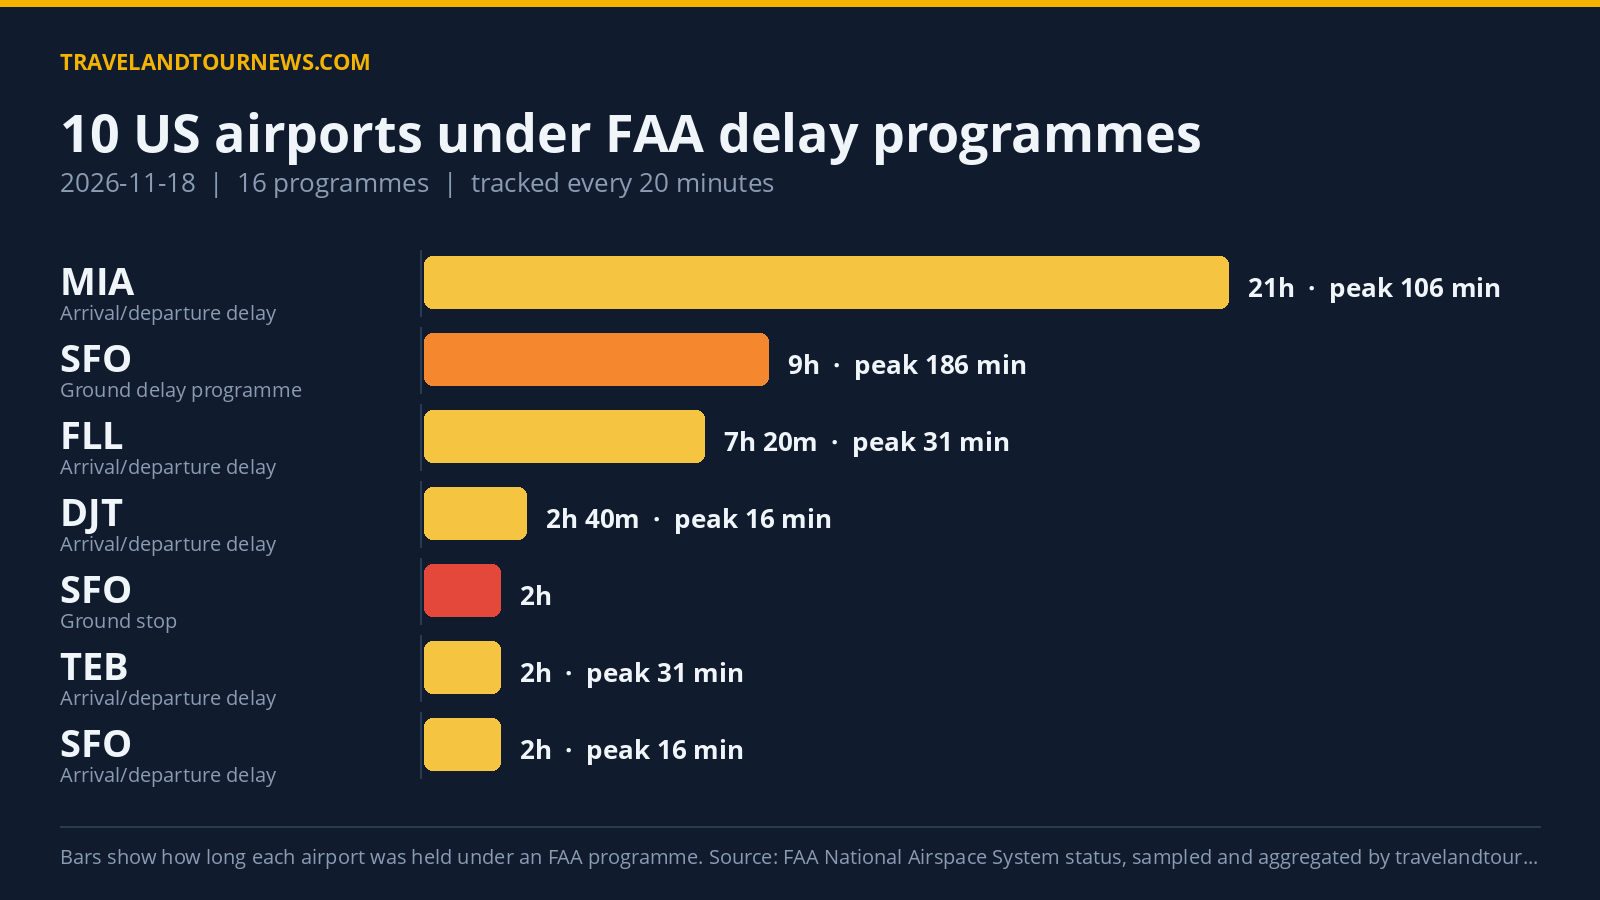

On November 18, 2026, the FAA implemented delay programs affecting 10 airports across the United States, totaling 16 delay programs. The worst-hit airport was San Francisco International (SFO), where peak maximum delays reached 658 minutes under a ground delay program.
Details of Airports and Delay Programmes
Among the 16 programs, there were five ground stop programs, one ground delay program, and 10 general arrival/departure delay advisories. A ground stop means flights bound for an airport were held at their origin on the ground, while a ground delay program meters arrivals by assigning later departure times.
San Francisco International (SFO) stood out with seven ground stop samples from 17:40 to 19:40 UTC lasting two hours due to wind, alongside a nine-hour ground delay program from 13:40 to 22:40 UTC also caused by wind. This ground delay program had the highest recorded peak average delay of 186 minutes
and a peak maximum delay of 658 minutes.
TEB experienced a five-sample ground stop for 1 hour 20 minutes due to airport volume, followed by a two-hour general delay status citing volume as well. Fort Lauderdale-Hollywood International (FLL) had a 40-minute ground stop for thunderstorms and a 7 hour 20 minute general delay program related to traffic management initiatives and thunderstorms.
Miami International (MIA) was under a three-sample ground stop for low visibility lasting 40 minutes and a 21-hour general delay program associated with traffic management initiatives and thunderstorms, exhibiting a peak average delay of 106 minutes. DJT had a
three-sample 40-minute ground stop for airport volume and a 2 hour 40 minute general delay period involving thunderstorms.
LaGuardia (LGA) had a general delay program with wind and runway change reasons for 1 hour 20 minutes with peak delays of 31 average and 45 maximum minutes. OPF, MDW, SAN, and SEA also saw general delay information notified by the FAA for thunderstorms, volume, compacted demand, and runway construction respectively, each lasting between 20 minutes and 1 hour 20 minutes.
| Airport | FAA programme | Cause | Peak average delay | In force (UTC) |
|---|---|---|---|---|
| San Francisco International (SFO) | Ground Stop Programs | wind | – | 17:40 to 19:40 (2 hours) |
| TEB | Ground Stop Programs | airport volume | – | 20:20 to 21:40 (1 hour 20 minutes) |
| Fort Lauderdale-Hollywood International (FLL) | Ground Stop Programs | thunderstorms | – | 13:40 to 14:20 (40 minutes) |
| Miami International (MIA) | Ground Stop Programs | low visibility | – | 14:20 to 15:00 (40 minutes) |
| DJT | Ground Stop Programs | airport volume | – | 19:20 to 20:00 (40 minutes) |
| San Francisco International (SFO) | Ground Delay Programs | wind | 186 min | 13:40 to 22:40 (9 hours) |
| Miami International (MIA) | General Arrival/Departure Delay Info | TM Initiatives:MIT:WX; WX:Thunderstorms | 106 min | 00:00 to 21:00 (21 hours) |
| Fort Lauderdale-Hollywood International (FLL) | General Arrival/Departure Delay Info | TM Initiatives:MIT:WX | 31 min | 00:20 to 07:40 (7 hours 20 minutes) |
| TEB | General Arrival/Departure Delay Info | VOL:Volume | 31 min | 19:40 to 21:40 (2 hours) |
| LaGuardia (LGA) | General Arrival/Departure Delay Info | WX:Wind; RWY:Rwy Change – Operational Advantage | 31 min | 15:20 to 16:40 (1 hour 20 minutes) |
| OPF | General Arrival/Departure Delay Info | WX:Thunderstorms | 31 min | 01:00 to 02:00 (1 hour) |
| Chicago Midway International (MDW) | General Arrival/Departure Delay Info | VOL:Volume | 31 min | 20:20 to 21:20 (1 hour) |
| DJT | General Arrival/Departure Delay Info | WX:Thunderstorms | 16 min | 17:00 to 19:40 (2 hours 40 minutes) |
| San Francisco International (SFO) | General Arrival/Departure Delay Info | WX:Wind | 16 min | 17:40 to 19:40 (2 hours) |
Wind and Weather Were Leading Causes of Delay
Weather-related causes dominated the delay programs. The single largest cause category was traffic management initiatives intertwined with weather (TM Initiatives:MIT:WX), accounting
for 39 samples. Wind-related causes appeared in two FAA classifications: generic ‘wind’ caused 35 samples, and specific ‘WX:Wind’ was cited 11 times.
Thunderstorms contributed to delays in 28 samples, including ground stops and general arrival/departure delay information. Airport volume issues and compaction of demand accounted for 11 samples each, contributing to ground stop and general delay statuses across multiple airports.
Trend Compared with Yesterday and Recent Average
Compared to November 17, 2026, when 7 airports were affected and 13 delay programs were recorded, November 18 saw a rise to 10 airports and 16 programs, an increase of 3 programs. The day’s affected airport count trailed the recent
seven-day average of 13.4 airports and does not represent the worst day in the tracking window.
Methodology. travelandtournews.com samples the FAA’s National Airspace System status feed every 20 minutes throughout the US operating day and aggregates the result. This report is built from 69 samples taken between 00:00 and 22:40 UTC on 2026-11-18. Durations are the observed window between the first and last sample in which a programme was in force, so a programme’s true length may be slightly longer than shown. Ground stops, ground delay programmes, airport closures and general delays are all published by the FAA in real
time; the daily aggregation is ours.