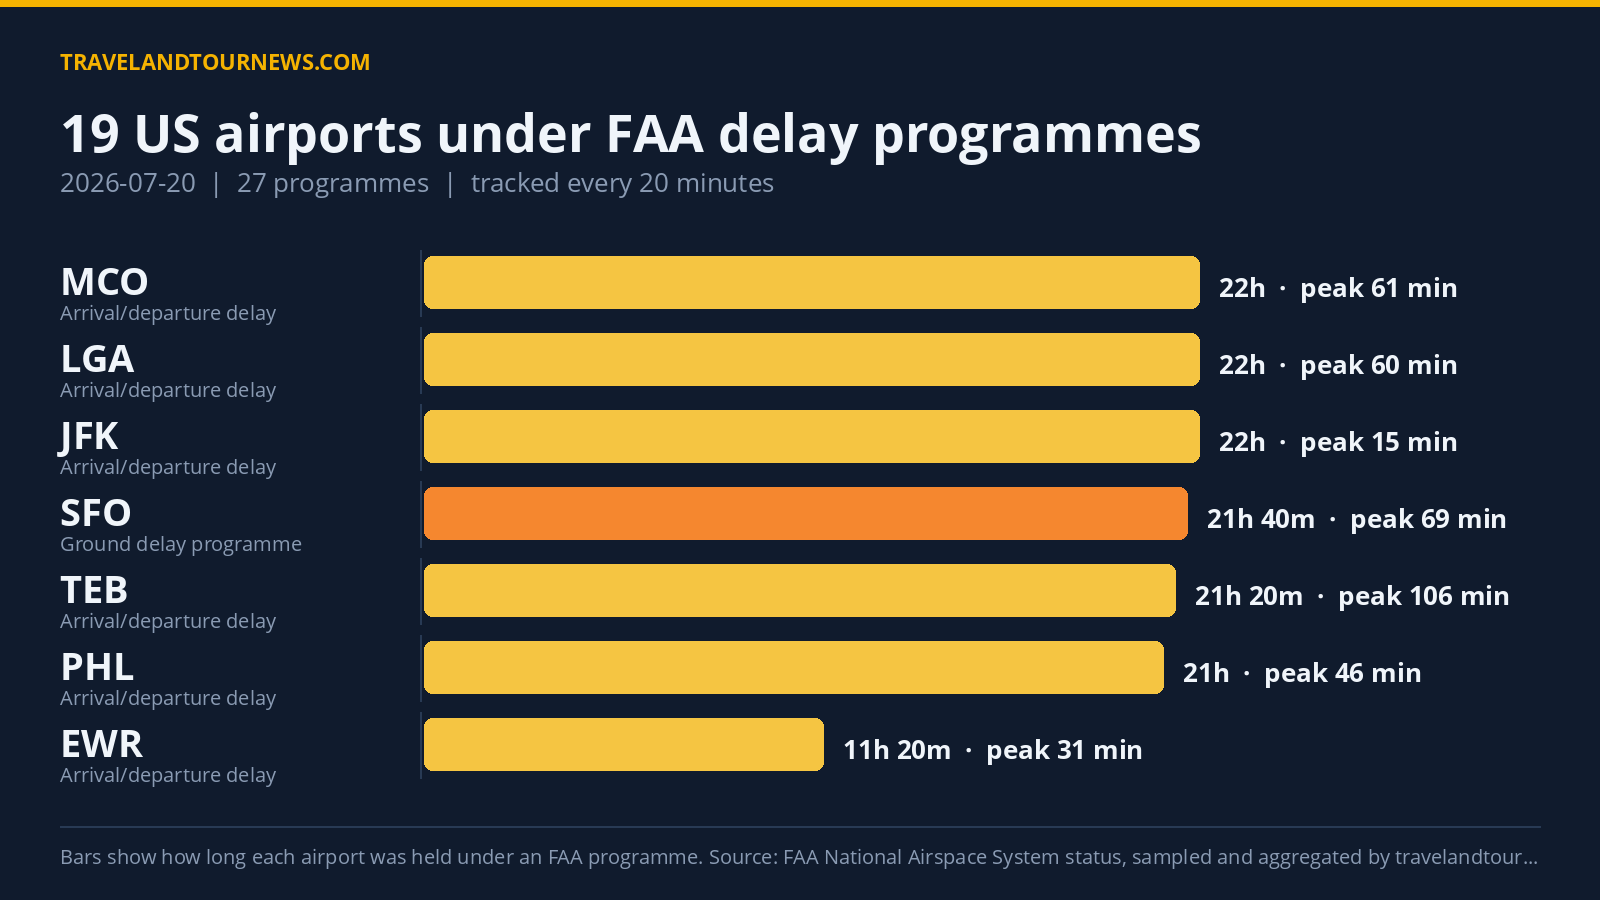

On July 20, 2026, the FAA held 19 airports in the United States under delay programs, with a total of 27 active programs throughout the day. The most affected airport was Teterboro Airport (TEB), which recorded peak delays reaching 313 minutes amid security and staffing constraints.
Delay Programs Across US Airports on July 20, 2026
Delay programs recorded by the FAA fall into four types: ground stop programs, ground delay programs, airport closures, and general arrival/departure delay information. A ground stop restricts departures bound for an airport, holding planes on the ground at their origin. A ground delay program meters arrivals to an airport by assigning flights later departure times.
On July 20, the FAA applied seven ground stop programs and four ground delay programs at various airports, alongside one airport closure and 15 general arrival/departure delay programs. Teterboro (TEB) had a ground stop lasting 1 hour and 20 minutes from midnight to 01:20 UTC,
citing security and staffing issues. Despite no average delay reported during this ground stop, the airport’s general delay programs spanning 21 hours 20 minutes throughout the day pushed peak average delay to 106 minutes and maximum delay to 120 minutes.
Other notable ground stops included Boston Logan International (BOS) for 1 hour 20 minutes due to wind, Newark Liberty International (EWR) for 1 hour caused by VIP movements, and Raleigh-Durham International (RDU) for 1 hour because of thunderstorms. Ground delay programs ranged from 20 minutes at Orlando International (MCO), attributed to tornado or hurricane conditions, to nearly 22 hours at
San Francisco International (SFO) under various “other” reasons. SFO registered the highest peak maximum delay on the day, reaching 313 minutes.
San Diego International (SAN) was closed for 4 hours 20 minutes starting at 08:20 UTC. The longest single delay program lasted 22 hours at Orlando International under a weather-related FAA Traffic Management Initiative.
| Airport | FAA programme | Cause | Peak average delay | In force (UTC) |
|---|---|---|---|---|
| TEB | Ground Stop Programs | security; STAFFING | – | 00:00 to 01:20 (1 hour 20 minutes) |
| Boston Logan International (BOS) | Ground Stop Programs | wind | – | 18:40 to 20:00 (1 hour 20 minutes) |
| Newark Liberty International (EWR) | Ground Stop Programs | VIP | – | 00:00 to 01:00 (1 hour) |
| Raleigh-Durham International (RDU) | Ground Stop Programs | thunderstorms | – | 20:20 to 21:20 (1 hour) |
| LaGuardia (LGA) | Ground Stop Programs | airspace volume | – | 00:20 to 00:20 (20 minutes) |
| Los Angeles International (LAX) | Ground Stop Programs | STAFFING | – | 15:20 to 15:20 (20 minutes) |
| Orlando International (MCO) | Ground Stop Programs | tornado or hurricane | – | 18:20 to 18:20 (20 minutes) |
| HPN | Ground Delay Programs | disabled aircraft on the runway | 94 min | 00:00 to 01:20 (1 hour 20 minutes) |
| Newark Liberty International (EWR) | Ground Delay Programs | other | 82 min | 00:00 to 02:40 (2 hours 40 minutes) |
| San Francisco International (SFO) | Ground Delay Programs | other; OTHER | 69 min | 00:20 to 22:00 (21 hours 40 minutes) |
| Boston Logan International (BOS) | Ground Delay Programs | wind | 32 min | 20:20 to 22:00 (1 hour 40 minutes) |
| San Diego International (SAN) | Airport Closures | airport closed | – | 08:20 to 12:40 (4 hours 20 minutes) |
| TEB | General Arrival/Departure Delay Info | VIPM:VIP Movement; TM Initiatives:STOP:VOL; VOL:Compacted Demand | 106 min | 00:00 to 21:20 (21 hours 20 minutes) |
| HPN | General Arrival/Departure Delay Info | TM Initiatives:Other:VOL | 76 min | 00:40 to 03:40 (3 hours) |
Causes Behind the Delay Programs
The leading causes for these delay programs reflect FAA’s official reasons. Traffic Management Initiatives related to weather—specifically “SWAP” and “MIT” components—were the most common, underpinning 57 and 38 programs respectively. Other causes included compacted demand for airspace and VIP movements.
Specific airport-related causes varied: disabled aircraft
on the runway delayed Westchester County Airport (HPN), while weather elements such as wind delayed Boston Logan (BOS), thunderstorms affected Raleigh-Durham (RDU) and Chicago O’Hare (ORD), and severe weather including tornadoes or hurricanes stalled Orlando (MCO). Security and staffing issues were unique to Teterboro’s ground stop.
Comparing July 20 with Recent Data Trends
Compared to July 19, 2026, the number of airports affected by delay programs dropped slightly from 21 to 19, and the total programs decreased from 32 to 27. Both figures remain below the seven-day average of approximately 20 airports affected and 27 programs active each day. The current day does not represent the worst
in the weekly tracking window.
Methodology. travelandtournews.com samples the FAA’s National Airspace System status feed every 20 minutes throughout the US operating day and aggregates the result. This report is built from 67 samples taken between 00:00 and 22:00 UTC on 2026-07-20. Durations are the observed window between the first and last sample in which a programme was in force, so a programme’s true length may be slightly longer than shown. Ground stops, ground delay programmes, airport closures and general delays are all published by the FAA in real time; the daily aggregation is ours.