
On July 26, 2026, the FAA held 11 airports in the United States under 15 delay programs, with Orlando International Airport (MCO) experiencing the longest and most severe impact. Orlando’s ground stop program due to thunderstorms lasted 2 hours and 40 minutes, marking it as the worst-affected airport on this day.
FAA Delay Programs Active Across 11 Airports
The 15 active delay programs included three ground stop programs, two ground delay programs, and ten general arrival/departure delay notices. Ground stops hold departures bound for an airport at their origin, while ground delay programs meter arrivals by assigning later departure times to reduce congestion.
Orlando International (MCO) saw a ground stop triggered by thunderstorms from 18:00 to 20:40 UTC, spanning 160 minutes. Although peak average and maximum delays were recorded as zero (likely referring to domestic metrics during the program), the duration highlights significant operational effects.
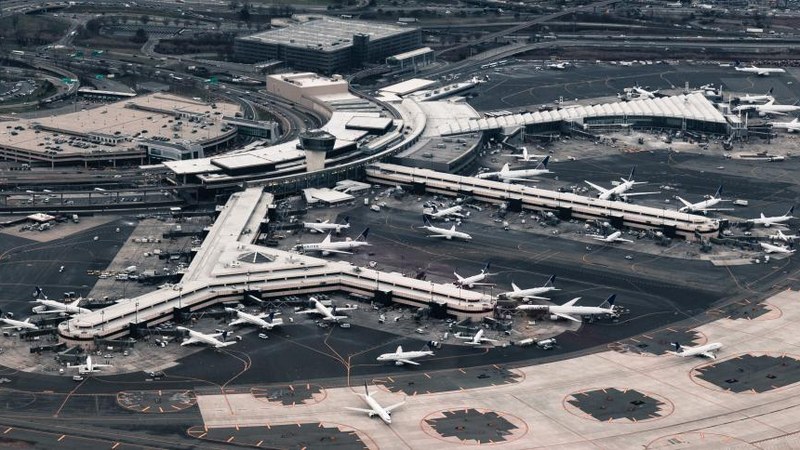
Smaller ground stop programs also occurred at San Diego International (SAN) and Newark
Liberty International (EWR), each lasting 20 minutes due to airport volume constraints. Newark additionally had a ground delay program between 00:00 and 01:20 UTC for “other” reasons, with peak average delays reaching 83 minutes and maximum delays peaking at 143 minutes.
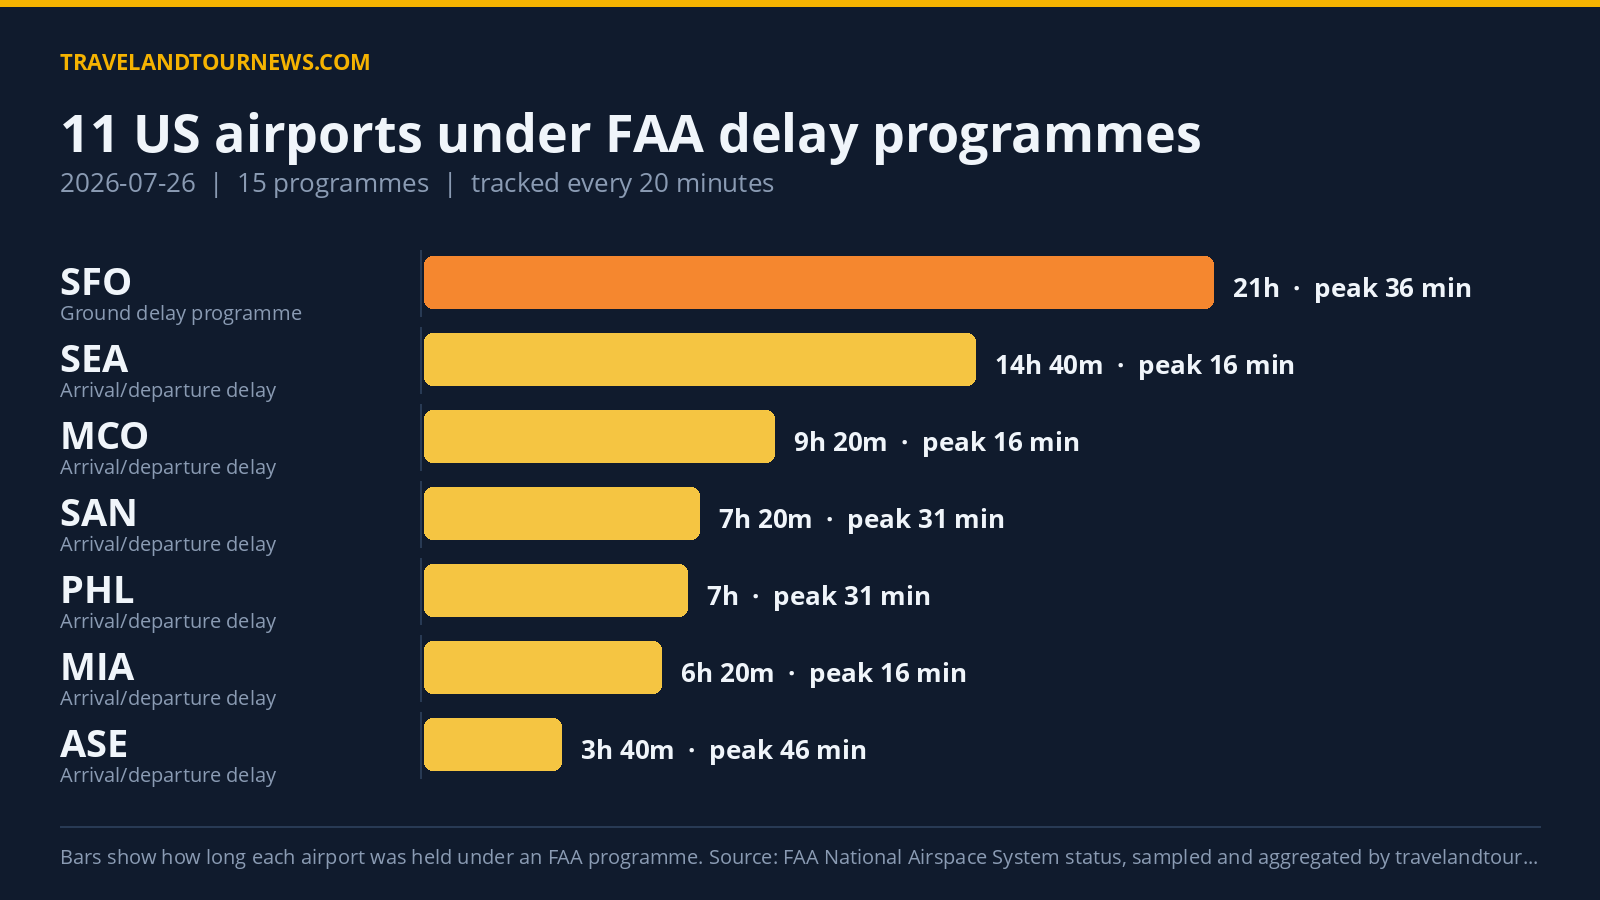
San Francisco International Airport (SFO) maintained a 21-hour ground delay program, from midnight to 21:00 UTC, prompted by “other” causes and low ceilings. Its peak average delay was 36 minutes with a maximum of 87 minutes recorded.
Other airports such as Aspen (ASE), San Diego (SAN), Philadelphia (PHL), Seattle-Tacoma (SEA), Miami (MIA), John F. Kennedy (JFK), Chicago O’Hare (ORD),
and Las Vegas (LAS) were affected by general arrival/departure delay programs of varying lengths and causes.
| Airport | FAA programme | Cause | Peak average delay | In force (UTC) |
|---|---|---|---|---|
| Orlando International (MCO) | Ground Stop Programs | thunderstorms | – | 18:00 to 20:40 (2 hours 40 minutes) |
| San Diego International (SAN) | Ground Stop Programs | airport volume | – | 01:40 to 02:00 (20 minutes) |
| Newark Liberty International (EWR) | Ground Stop Programs | airport volume | – | 17:40 to 18:00 (20 minutes) |
| Newark Liberty International (EWR) | Ground Delay Programs | other | 83 min | 00:00 to 01:20 (1 hour 20 minutes) |
| San Francisco International (SFO) | Ground Delay Programs | other; low ceilings | 36 min | 00:00 to 21:00 (21 hours) |
| ASE | General Arrival/Departure Delay Info | VOL:Volume | 46 min | 16:20 to 20:00 (3 hours 40 minutes) |
| San Diego International (SAN) | General Arrival/Departure Delay Info | VOL:Compacted Demand | 31 min | 14:00 to 21:20 (7 hours 20 minutes) |
| Philadelphia International (PHL) | General Arrival/Departure Delay Info | TM Initiatives:MIT:VOL; TM Initiatives:SWAP:WX | 31 min | 14:00 to 21:00 (7 hours) |
| Newark Liberty International (EWR) | General Arrival/Departure Delay Info | ZDC / TM Initiatives:MIT:VOL | 31 min | 17:20 to 20:40 (3 hours 20 minutes) |
| Seattle-Tacoma International (SEA) | General Arrival/Departure Delay Info | VOL:Compacted Demand | 16 min | 01:40 to 16:20 (14 hours 40 minutes) |
| Orlando International (MCO) | General Arrival/Departure Delay Info | TM Initiatives:MIT:VOL; TM Initiatives:MIT:WX | 16 min | 11:40 to 21:00 (9 hours 20 minutes) |
| Miami International (MIA) | General Arrival/Departure Delay Info | TM Initiatives:MIT:WX | 16 min | 15:40 to 22:00 (6 hours 20 minutes) |
| John F. Kennedy International (JFK) | General Arrival/Departure Delay Info | STAFF:Staffing | 16 min | 13:40 to 17:00 (3 hours 20 minutes) |
| Chicago O’Hare International (ORD) | General Arrival/Departure Delay Info | VOL:Volume | 16 min | 00:00 to 02:00 (2 hours) |
Delay Causes Concentrated on Weather and Volume
The FAA’s official reasons clustered into five major categories driving delays: low ceilings (26 instances), volume-related issues (19), weather-related traffic management initiatives (14), compacted demand (13), and other miscellaneous causes (12).
Thunderstorms caused the longest ground stop at Orlando, while low ceilings significantly impacted San Francisco’s prolonged ground delay program. Airport volume issues prompted ground stops at Newark and San Diego.
Traffic management initiatives related to weather and volume, such as those at Philadelphia and Seattle, also contributed to general delays. The FAA categorized
these under TM Initiatives with codes like MIT:WX and MIT:VOL.
Comparing July 26 With Previous Days
July 26 recorded 11 airports affected by delay programs, down by one airport from the 12 impacted on July 25. Total delay programs increased slightly from 13 to 15. Compared to the 7-day average, which shows 17.7 airports affected, today’s figures remain below typical volume for the period.
Despite the longest individual program lasting 21 hours at San Francisco, the day is not the worst in the recent tracking window for airports or programs.
Underlying feed data sourced from FAA National Airspace System status feed, sampled all day by travelandtournews.com.
Methodology. travelandtournews.com samples the FAA’s National Airspace System status feed every 20 minutes throughout the US operating day and aggregates the result. This report is built from 67 samples taken between 00:00 and 22:00 UTC on 2026-07-26. Durations are the observed window between the first and last sample in which a programme was in force, so a programme’s true length may be slightly longer than shown. Ground stops, ground delay programmes, airport closures and general delays are all published by the FAA in real time; the daily aggregation is ours.