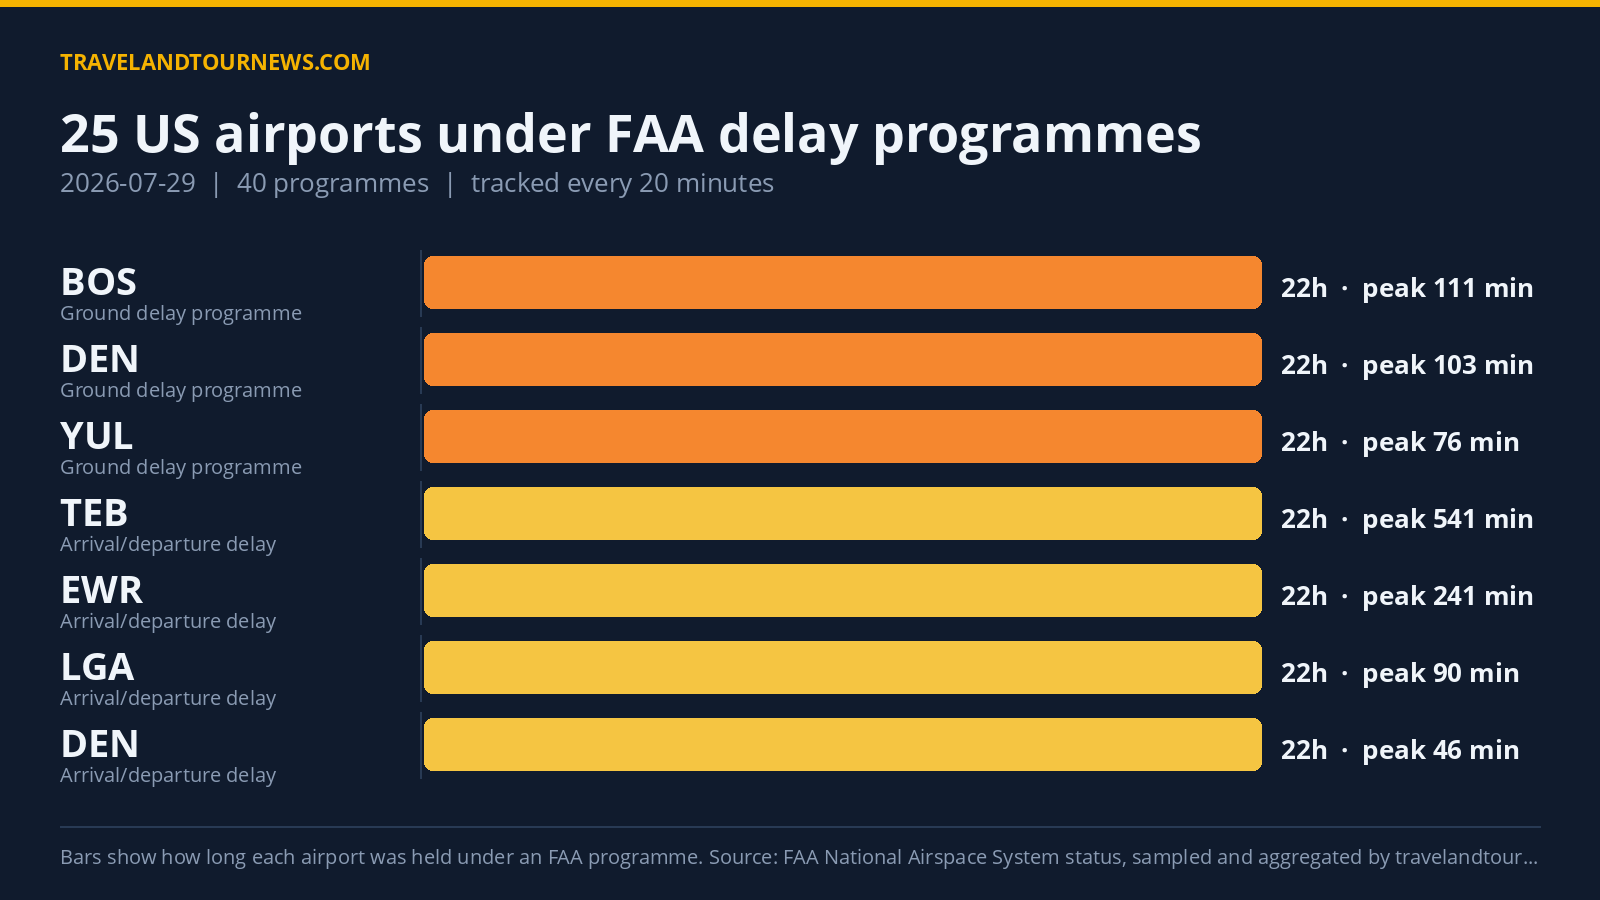

On July 29, 2026, 25 airports across the United States were under FAA delay programmes for a total of 40 distinct delay events. The worst-hit airport, LaGuardia (LGA), faced the longest ground stop programme, active for 21 hours and 40 minutes, stemming from thunderstorms and airport volume constraints.
Delay Programmes Across Airports and Types
The FAA enforced 14 Ground Stop programmes, which prevent departures from origin airports bound for affected airports, and 9 Ground Delay programmes that meter arrival times by imposing delayed departure slots. The remaining 17 programmes detailed general arrival and departure delay information without flight restrictions.
LaGuardia (LGA) experienced the lengthiest ground stop, active from 00:00 UTC to 21:40 UTC with 16 status samples. Despite the extended duration, LGA’s recorded peak maximum and average delays were listed as zero minutes, as this programme primarily held flights on the ground at their origins. Other airports with ground stop programmes attributed to thunderstorms
included JFK, Newark (EWR), Teterboro (TEB), and Philadelphia (PHL), with durations ranging from 20 minutes up to 3 hours and 40 minutes.
Ground Delay programmes showed significant delays, particularly at Newark (EWR), where peak average delay reached 424 minutes and the maximum delay hit 1,236 minutes across a six-hour-and-20-minute period observed in 20 samples. Teterboro (TEB) and Philadelphia (PHL) also recorded extended delays, with peak averages of 408 and 153 minutes respectively.
Boston Logan (BOS) and Denver (DEN) had ground delay programmes spanning 22 hours each. BOS’s delays peaked at an average of 111 minutes, influenced by thunderstorms and low
ceilings; DEN’s reached 103 minutes on average, caused predominantly by thunderstorms alone.
| Airport | FAA programme | Cause | Peak average delay | In force (UTC) |
|---|---|---|---|---|
| LaGuardia (LGA) | Ground Stop Programs | thunderstorms; airport volume | – | 00:00 to 21:40 (21 hours 40 minutes) |
| John F. Kennedy International (JFK) | Ground Stop Programs | thunderstorms | – | 00:00 to 03:40 (3 hours 40 minutes) |
| TEB | Ground Stop Programs | thunderstorms; THUNDERSTORMS | – | 00:00 to 03:40 (3 hours 40 minutes) |
| MMU | Ground Stop Programs | thunderstorms | – | 00:00 to 03:40 (3 hours 40 minutes) |
| Newark Liberty International (EWR) | Ground Stop Programs | thunderstorms | – | 00:00 to 03:20 (3 hours 20 minutes) |
| CDW | Ground Stop Programs | thunderstorms | – | 00:00 to 03:00 (3 hours) |
| Philadelphia International (PHL) | Ground Stop Programs | thunderstorms | – | 00:00 to 02:20 (2 hours 20 minutes) |
| Charlotte Douglas International (CLT) | Ground Stop Programs | other | – | 00:00 to 01:00 (1 hour) |
| Denver International (DEN) | Ground Stop Programs | thunderstorms | – | 21:00 to 22:00 (1 hour) |
| Miami International (MIA) | Ground Stop Programs | other | – | 00:00 to 00:20 (20 minutes) |
| Ronald Reagan Washington National (DCA) | Ground Stop Programs | thunderstorms | – | 00:00 to 00:20 (20 minutes) |
| Washington Dulles International (IAD) | Ground Stop Programs | thunderstorms | – | 00:00 to 00:20 (20 minutes) |
| Baltimore/Washington International (BWI) | Ground Stop Programs | thunderstorms | – | 00:00 to 00:20 (20 minutes) |
| Orlando International (MCO) | Ground Stop Programs | thunderstorms | – | 21:40 to 22:00 (20 minutes) |
Thunderstorms and Weather Were the Primary Causes
Thunderstorms were the leading cause of both ground stops and ground delay programmes, appearing in 127 delay samples, followed closely by traffic management initiatives related to weather (identified as TM Initiatives:SWAP:WX) at 109 instances. Low ceilings contributed to 49 delay occurrences, and other causes added 18 samples.
Several airports specifically attributed thunderstorms to their ground stop status: LaGuardia (LGA), John F. Kennedy International (JFK), Teterboro (TEB), Newark Liberty International (EWR), Philadelphia International (PHL), and others. Airport volume was cited alongside thunderstorms solely at LaGuardia. Runway construction was a
factor only at Montreal (YUL).
Other causes recorded by the FAA for delay programmes included various non-weather-related factors, such as at Charlotte Douglas (CLT) and Miami International (MIA). San Francisco International (SFO) and Vancouver (YVR) cited a combination of low ceilings and other reasons.
Comparison to Previous Day and Weekly Averages
On July 29, 2026, the number of airports affected was 25, one fewer than the 26 recorded on the previous day. The total number of programmes decreased from 44 to 40. Compared to a seven-day average of 16.4 airports affected, the current day reported significantly more impacted airports. Despite this volume, the data does not indicate
that July 29 represents the worst delay conditions in the recent tracking window.
Methodology. travelandtournews.com samples the FAA’s National Airspace System status feed every 20 minutes throughout the US operating day and aggregates the result. This report is built from 67 samples taken between 00:00 and 22:00 UTC on 2026-07-29. Durations are the observed window between the first and last sample in which a programme was in force, so a programme’s true length may be slightly longer than shown. Ground stops, ground delay programmes, airport closures and general delays are all published by the FAA in real time; the daily
aggregation is ours.