
On August 7, 2026, the FAA held 24 airports across the United States under 44 total delay programmes, according to FAA data tracked by travelandtournews.com. The worst-affected airport was John F. Kennedy International (JFK), which experienced ground delay programmes with peak maximum delays reaching 920 minutes.
Airport Delay Programmes and Peak Delays
The 24 affected airports included major hubs such as JFK, LaGuardia (LGA), Newark Liberty (EWR), Boston Logan (BOS), Philadelphia International (PHL), Ronald Reagan Washington National (DCA), Baltimore/Washington International (BWI), and others. Delay programmes consisted of 12 ground stop programmes, 11 ground delay programmes, and 21 reports of general arrival/departure delay information. A ground stop holds departures bound for an airport on the ground at their origin, while a ground delay programme meters arrivals by assigning later departure times.
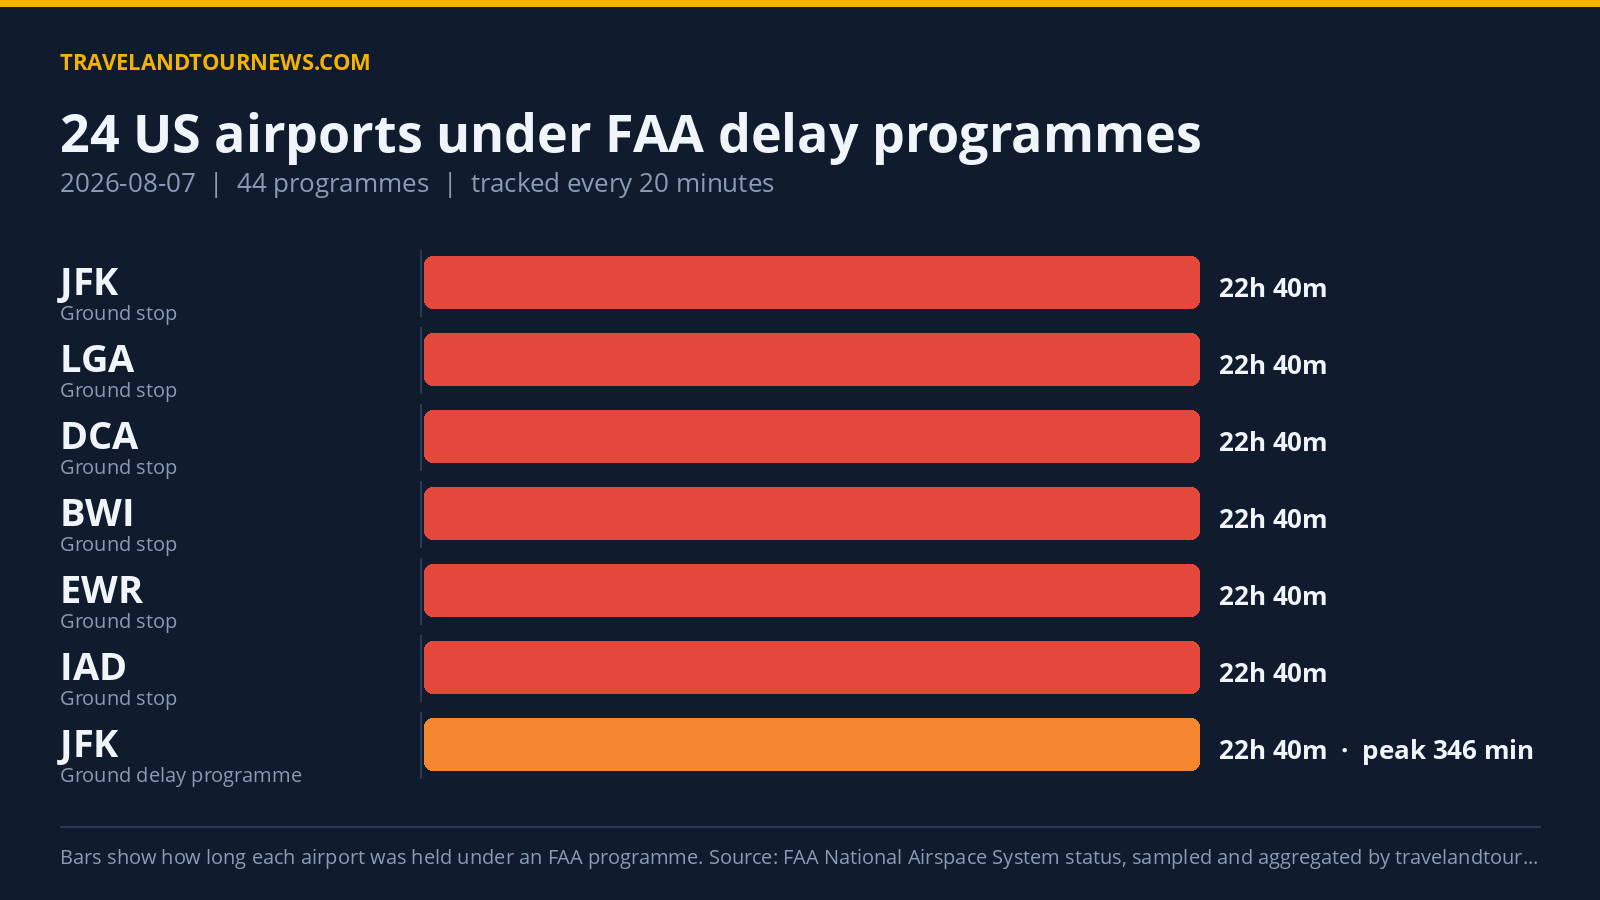
Ground stop programmes lasted as long as 22 hours and 40 minutes at JFK, LaGuardia, DCA, BWI, EWR, and IAD, all primarily
caused by thunderstorms. For ground delay programmes, JFK again led with a longest duration of 22 hours and 40 minutes, peak average delay of 346 minutes, and peak maximum delay of 920 minutes. Other airports with prolonged ground delay programmes included EWR and BOS, with peak delays of 273 and 842 minutes respectively. San Diego International (SAN) suffered delays mostly due to airport volume, peaking at 107 minutes maximum delay over 22 hours and 40 minutes.
| Airport | FAA programme | Cause | Peak average delay | In force (UTC) |
|---|---|---|---|---|
| John F. Kennedy International (JFK) | Ground Stop Programs | thunderstorms | – | 00:00 to 22:40 (22 hours 40 minutes) |
| LaGuardia (LGA) | Ground Stop Programs | thunderstorms | – | 00:00 to 22:40 (22 hours 40 minutes) |
| Ronald Reagan Washington National (DCA) | Ground Stop Programs | thunderstorms; other; OTHER | – | 00:00 to 22:40 (22 hours 40 minutes) |
| Baltimore/Washington International (BWI) | Ground Stop Programs | thunderstorms | – | 00:00 to 22:40 (22 hours 40 minutes) |
| Newark Liberty International (EWR) | Ground Stop Programs | thunderstorms | – | 00:00 to 22:40 (22 hours 40 minutes) |
| Washington Dulles International (IAD) | Ground Stop Programs | thunderstorms | – | 00:00 to 22:40 (22 hours 40 minutes) |
| Philadelphia International (PHL) | Ground Stop Programs | thunderstorms | – | 20:40 to 22:40 (2 hours) |
| Hartsfield-Jackson Atlanta International (ATL) | Ground Stop Programs | thunderstorms | – | 00:20 to 02:00 (1 hour 40 minutes) |
| TEB | Ground Stop Programs | other | – | 21:00 to 22:40 (1 hour 40 minutes) |
| Boston Logan International (BOS) | Ground Stop Programs | thunderstorms | – | 19:20 to 20:00 (40 minutes) |
| Orlando International (MCO) | Ground Stop Programs | thunderstorms | – | 00:00 to 00:20 (20 minutes) |
| BNA | Ground Stop Programs | thunderstorms | – | 22:40 to 22:40 (20 minutes) |
| John F. Kennedy International (JFK) | Ground Delay Programs | thunderstorms | 346 min | 00:00 to 22:40 (22 hours 40 minutes) |
| Newark Liberty International (EWR) | Ground Delay Programs | other; thunderstorms | 273 min | 00:00 to 22:40 (22 hours 40 minutes) |
Thunderstorms Were the Leading Cause of Delay Programmes
Thunderstorms dominated delay causes with 259 samples citing them, followed by Traffic Management Initiatives under weather (TM Initiatives:SWAP:WX) at 159 samples. Airport volume and
unspecified “other” reasons accounted for 38 and 37 samples respectively. Variants of thunderstorm-related causes, including “WX:Thunderstorms,” added 29 more. Overall, thunderstorms factored into all ground stop programmes at JFK, LGA, DCA, BWI, EWR, and others. They also underpinned ground delay programmes at JFK, BOS, LGA, PHL, and DCA. Airport volume was the top cause at San Diego, while other miscellaneous reasons applied at a subset of airports including Newark for certain ground delays and TEB for a short ground stop.
Comparison with Previous Day and Weekly Average
The number of airports affected (24) on August 7 was down by four from 28 airports affected the previous day.
Total programmes dropped by three from 47 to 44. The affected airports count was above the seven-day average of 21 but did not represent the worst day in that window. These figures indicate a slight decline from the previous day yet remain elevated compared with recent averages.
Methodology. travelandtournews.com samples the FAA’s National Airspace System status feed every 20 minutes throughout the US operating day and aggregates the result. This report is built from 66 samples taken between 00:00 and 22:40 UTC on 2026-08-07. Durations are the observed window between the first and last sample in which a programme was
in force, so a programme’s true length may be slightly longer than shown. Ground stops, ground delay programmes, airport closures and general delays are all published by the FAA in real time; the daily aggregation is ours.