
On August 3, 2026, the FAA held 22 airports in the United States under 40 delay programs in total. Newark Liberty International Airport (EWR) was the worst-hit airport, recording a peak maximum delay of 551 minutes.
Details on Airports and Delay Programmes
The FAA implemented 14 Ground Stop Programs, 8 Ground Delay Programs, and recorded 18 General Arrival/Departure Delay Info programs throughout the day. A ground stop holds departures bound for an airport on the ground at their origin to prevent further congestion; a ground delay program meters arrivals by assigning later departure times.
Ground Stop Programs were widely applied at major airports affected by thunderstorms. Ronald Reagan Washington National Airport (DCA) had a ground stop in effect from 00:00 to 19:20 UTC, lasting 19 hours and 20 minutes, though it did not record peak average or maximum delay minutes. Nearby Washington
Dulles International (IAD) had a similar ground stop mirrored by the same duration. Newark Liberty International (EWR) experienced a ground stop from 00:00 to 18:20 UTC over 18 hours and 20 minutes, also with zero peak recorded delays.
LaGuardia (LGA) had a ground stop from 00:20 to 18:40 UTC for 18 hours and 20 minutes, and John F. Kennedy International (JFK) recorded a shorter ground stop starting at 13:20 and ending at 21:00 UTC, lasting 7 hours and 40 minutes. Tampa International (TPA) faced a ground stop of 4 hours from 11:40 to 15:40 UTC. Other airports with ground stops
driven mostly by thunderstorms included Philadelphia (PHL), Fort Lauderdale-Hollywood (FLL), Boston Logan (BOS), Baltimore/Washington International (BWI), and Miami International (MIA), with durations ranging from 20 minutes to several hours.
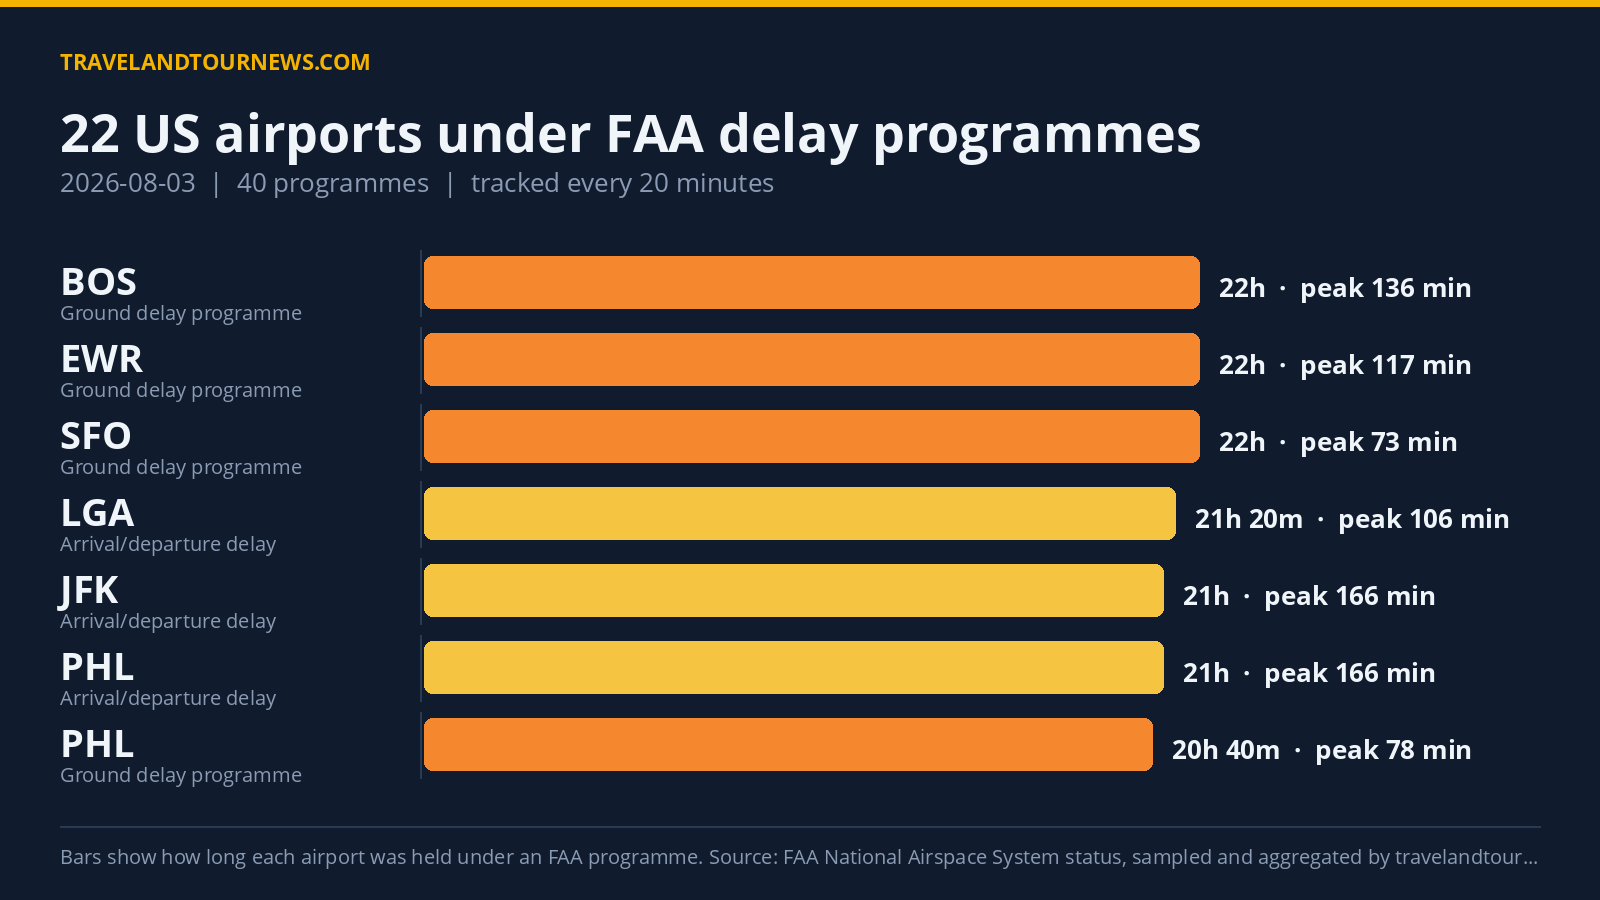
In contrast, Ground Delay Programs affected airports for extended periods as well. Boston Logan (BOS) was under a Ground Delay Program for 22 hours, from 00:00 to 22:00 UTC, with a peak average delay of 136 minutes and a peak maximum delay of 391 minutes. Newark Liberty International (EWR) also had a 22-hour Ground Delay Program matching BOS’s duration, with a peak average delay of 117 minutes and a peak maximum
delay of 551 minutes.
Miami International (MIA) experienced a shorter Ground Delay Program lasting 1 hour 40 minutes, with a peak average delay of 100 minutes and a peak maximum delay of 254 minutes. LaGuardia (LGA) had a 2-hour Ground Delay Program due to wind, showing peak average delays of 86 minutes and a peak maximum delay of 149 minutes.
Philadelphia International (PHL) had a combined 20-hour 40-minute Ground Delay Program featuring thunderstorms and a peak maximum delay of 175 minutes. San Francisco International (SFO) was under a Ground Delay Program caused by other factors for the full 22 hours,
with peak average and maximum delays of 73 and 150 minutes respectively. San Diego International (SAN) experienced a 3-hour 20-minute Ground Delay Program related to airport volume, with peak average delays of 30 minutes and a max of 72 minutes.
| Airport | FAA programme | Cause | Peak average delay | In force (UTC) |
|---|---|---|---|---|
| Ronald Reagan Washington National (DCA) | Ground Stop Programs | thunderstorms | – | 00:00 to 19:20 (19 hours 20 minutes) |
| Washington Dulles International (IAD) | Ground Stop Programs | thunderstorms | – | 00:00 to 19:20 (19 hours 20 minutes) |
| Newark Liberty International (EWR) | Ground Stop Programs | thunderstorms; other | – | 00:00 to 18:20 (18 hours 20 minutes) |
| LaGuardia (LGA) | Ground Stop Programs | thunderstorms | – | 00:20 to 18:40 (18 hours 20 minutes) |
| John F. Kennedy International (JFK) | Ground Stop Programs | thunderstorms | – | 13:20 to 21:00 (7 hours 40 minutes) |
| Tampa International (TPA) | Ground Stop Programs | thunderstorms | – | 11:40 to 15:40 (4 hours) |
| Philadelphia International (PHL) | Ground Stop Programs | thunderstorms | – | 00:40 to 03:20 (2 hours 40 minutes) |
| TEB | Ground Stop Programs | thunderstorms | – | 17:00 to 18:20 (1 hour 20 minutes) |
| ASE | Ground Stop Programs | airport volume | – | 16:20 to 17:00 (40 minutes) |
| Miami International (MIA) | Ground Stop Programs | thunderstorms | – | 19:20 to 20:00 (40 minutes) |
| Fort Lauderdale-Hollywood International (FLL) | Ground Stop Programs | thunderstorms | – | 19:20 to 20:00 (40 minutes) |
| Boston Logan International (BOS) | Ground Stop Programs | thunderstorms | – | 13:20 to 13:40 (20 minutes) |
| Orlando International (MCO) | Ground Stop Programs | thunderstorms | – | 15:40 to 16:00 (20 minutes) |
| Baltimore/Washington International (BWI) | Ground Stop Programs | thunderstorms | – | 19:20 to 19:20 (20 minutes) |
Thunderstorms Dominated Delay Causes on August 3
The leading cause behind delay programs on August 3 was thunderstorms. The FAA’s own data shows thunderstorms drove 183 out of all program samples and were especially prevalent at the busiest airports. The most frequent program reason was “TM Initiatives:SWAP:WX” with 192 samples, closely related to thunderstorms.
Other causes included airport volume-related delays, accounting for programs at ASE and SAN,
and wind delays, notably at LaGuardia. Weather-related delays combining thunderstorm impacts (including “WX:Thunderstorms”) and other unspecified weather factors were dominant. The FAA’s stated reasons also included “other” causes for some programs, particularly at San Francisco and Newark Liberty International.
Comparison to Yesterday and Averages
Compared with the previous day, August 3 saw a slight decrease in the total number of delay programs, dropping from 42 to 40. The number of airports affected decreased by two, from 24 to 22, matching the seven-day average count of 22 airports under delay programs. August 3 does not represent the worst performance in the recent tracking window but aligns
closely with typical delay levels for the time.
The overall delay impacts remained severe at key airports but were consistent with average conditions experienced in the past week. Newark maintained the longest-duration delay programs alongside Boston Logan, while Washington-area airports notably experienced long ground stops due to thunderstorms.
Methodology. travelandtournews.com samples the FAA’s National Airspace System status feed every 20 minutes throughout the US operating day and aggregates the result. This report is built from 66 samples taken between 00:00 and 22:00 UTC on 2026-08-03. Durations are the observed window between the first and last sample in which a programme
was in force, so a programme’s true length may be slightly longer than shown. Ground stops, ground delay programmes, airport closures and general delays are all published by the FAA in real time; the daily aggregation is ours.