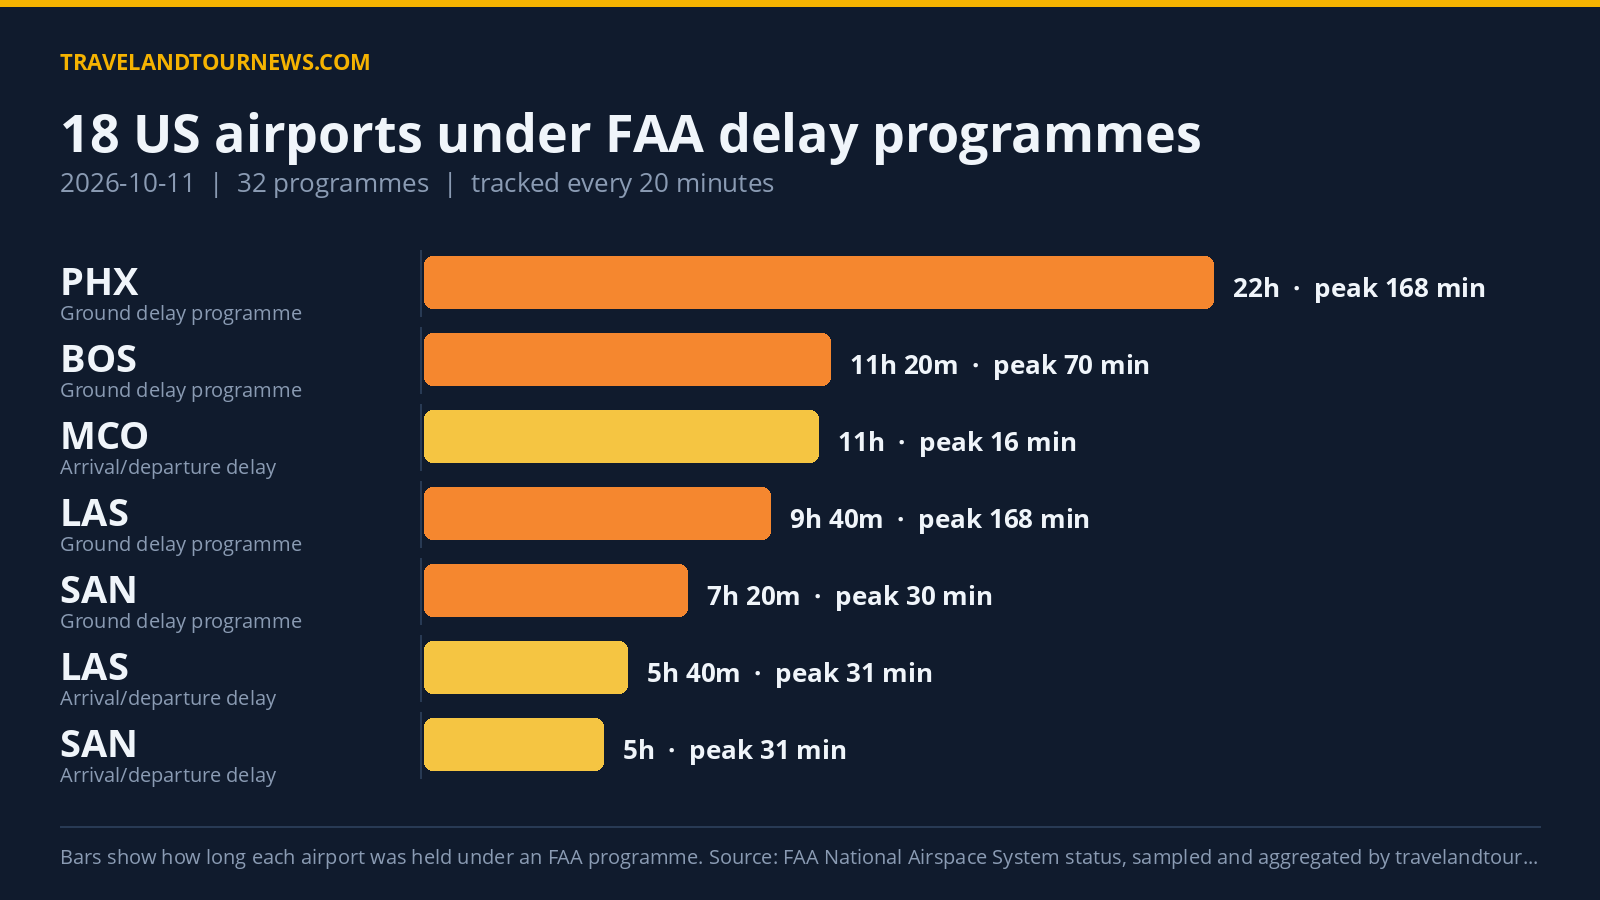

On October 11, 2026, the Federal Aviation Administration held 18 US airports under 32 delay programmes in total. Newark Liberty International Airport (EWR) was the worst-hit airport with ground stop programmes lasting two hours, facing airspace volume and low ceiling issues, and peak delays recorded up to 325 minutes.
Delay Programmes Across Airports and Their Duration
The FAA delay programmes included 10 ground stop programmes, 9 ground delay programmes, 1 airport closure, and 12 general arrival/departure delay information records. A ground stop programme holds departures bound for an airport on the ground at their origin; a ground delay programme meters arrivals by assigning later departure times.
The longest programme ran at Phoenix Sky Harbor International (PHX) lasting 22 hours, involving ground delays for reasons including low ceilings, wind, and other factors. At PHX, peak average delays reached 168 minutes, with maximum delay spikes hitting 325 minutes.
Harry Reid International (LAS) experienced a 9-hour 40-minute ground delay
programme driven by low ceilings, with peak average delays mirroring PHX’s 168 minutes and a maximum delay of 277 minutes. Boston Logan International (BOS) operated under a ground delay programme for 11 hours and 20 minutes due to runway construction, with peak average delays of 70 minutes and maximum delays up to 180 minutes.
San Diego International (SAN) underwent both an airport closure for 4 hours and 20 minutes and a ground delay programme related to airport volume lasting 7 hours and 20 minutes. During the closure, no delay figures were reported, but ground delay peak average delays reached 30
minutes with a peak maximum of 86 minutes.
| Airport | FAA programme | Cause | Peak average delay | In force (UTC) |
|---|---|---|---|---|
| Newark Liberty International (EWR) | Ground Stop Programs | airspace volume; low ceilings; LOW | – | 20:40 to 22:40 (2 hours) |
| Raleigh-Durham International (RDU) | Ground Stop Programs | thunderstorms | – | 16:20 to 17:40 (1 hour 20 minutes) |
| Harry Reid International (LAS) | Ground Stop Programs | low ceilings | – | 14:00 to 14:40 (40 minutes) |
| Orlando International (MCO) | Ground Stop Programs | thunderstorms | – | 14:00 to 14:40 (40 minutes) |
| Phoenix Sky Harbor International (PHX) | Ground Stop Programs | wind | – | 16:00 to 16:40 (40 minutes) |
| Charlotte Douglas International (CLT) | Ground Stop Programs | thunderstorms | – | 12:00 to 12:20 (20 minutes) |
| Ronald Reagan Washington National (DCA) | Ground Stop Programs | low ceilings | – | 18:20 to 18:40 (20 minutes) |
| John F. Kennedy International (JFK) | Ground Stop Programs | bird strike | – | 19:40 to 19:40 (20 minutes) |
| LaGuardia (LGA) | Ground Stop Programs | low ceilings | – | 22:20 to 22:40 (20 minutes) |
| TEB | Ground Stop Programs | other | – | 22:20 to 22:40 (20 minutes) |
| Phoenix Sky Harbor International (PHX) | Ground Delay Programs | other; low ceilings; wind | 168 min | 00:00 to 22:00 (22 hours) |
| Harry Reid International (LAS) | Ground Delay Programs | low ceilings | 168 min | 13:00 to 22:40 (9 hours 40 minutes) |
| John F. Kennedy International (JFK) | Ground Delay Programs | low ceilings | 76 min | 20:00 to 22:40 (2 hours 40 minutes) |
| Boston Logan International (BOS) | Ground Delay Programs | runway construction | 70 min | 11:20 to 22:40 (11 hours 20 minutes) |
Causes Behind Delay Programmes on October 11
The FAA cited low ceilings as the top cause behind delay programmes, appearing 89 times across the dataset. Runway construction was the second most frequent cause with 41 recorded instances. Other causes included various unspecified factors listed as “other” (32), traffic management initiatives related to weather (27), and airport volume constraints (23).
Severe weather conditions such as thunderstorms prompted ground stops at multiple airports, including Raleigh-Durham International (RDU) and Orlando International (MCO). Wind conditions affected Phoenix and Las Vegas ground stops and delays. Additionally, unique incidents such as a bird strike caused
a short ground stop at John F. Kennedy International (JFK).
Comparison With Previous Day and Recent Averages
Compared with October 10, 2026, when 17 airports were affected under 24 programmes, October 11 shows a slight increase with 18 airports under 32 programmes. This represents the highest number of programmes in the FAA feed’s seven-day tracking window average of 14.7 airports affected daily. The data indicates October 11 had the greatest airport delay programme activity compared to recent days within the United States.
Methodology. travelandtournews.com samples the FAA’s National Airspace System status feed every 20 minutes throughout the US operating day and aggregates the result. This report is
built from 69 samples taken between 00:00 and 22:40 UTC on 2026-10-11. Durations are the observed window between the first and last sample in which a programme was in force, so a programme’s true length may be slightly longer than shown. Ground stops, ground delay programmes, airport closures and general delays are all published by the FAA in real time; the daily aggregation is ours.