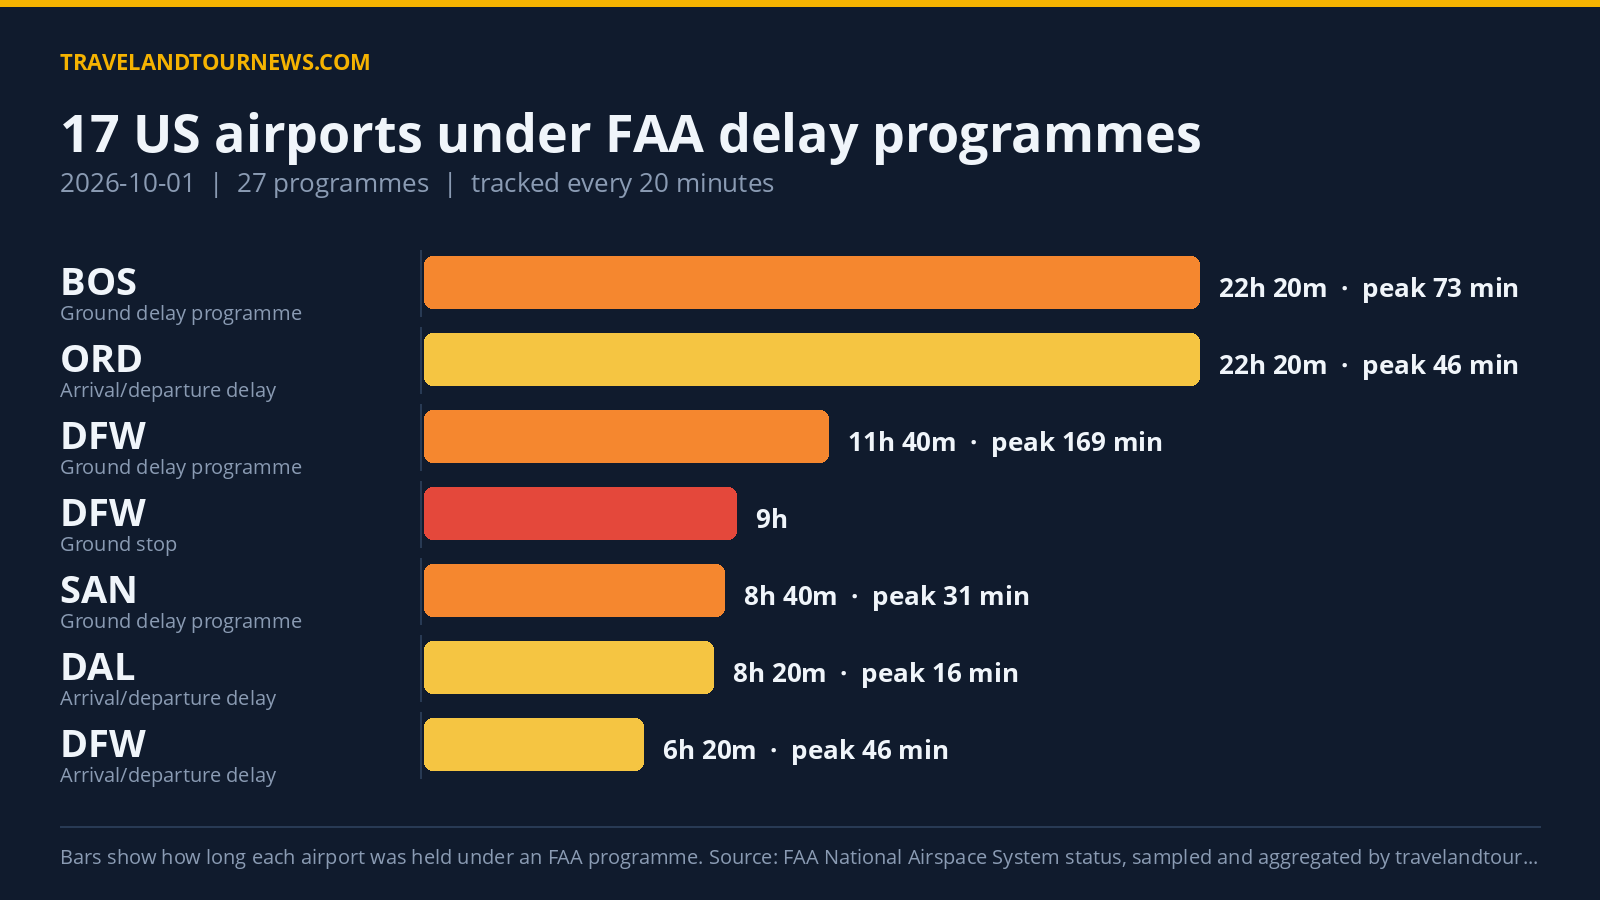

FAA data tracked by travelandtournews.com shows that on October 1, 2026, 17 US airports were held under 27 delay programs. Dallas/Fort Worth International Airport (DFW) was the worst affected with a peak maximum delay of 1387 minutes reported during the day.
Airports and Program Types: Ground Stops, Ground Delays, and General Delay Info
On October 1, 2026, 17 airports across the United States operated under FAA delay programs. The delays fell into three categories: 8 Ground Stop Programs, which hold departures at originating airports until conditions improve; 7 Ground Delay Programs, which meter arrivals by assigning later departure times; and 12 General Arrival/Departure Delay Info programs, which provide information on delays without restricting flights.
Ground Stop Programs notably affected several Texas airports including Dallas/Fort Worth International (DFW) with two programs totaling 15 samples over 9 hours and 540 minutes observed, implicated by thunderstorms and VIP movements. Dallas Love Field (DAL) had an 11-sample
4-hour ground stop due to thunderstorms. Austin (AUS), San Antonio (SAT), Houston Hobby (HOU), and George Bush Intercontinental (IAH) also experienced ground stops predominantly caused by thunderstorms. San Francisco International (SFO) had a shorter 40-minute ground stop due to low ceilings.
Ground Delay Programs lasted longest at Boston Logan International (BOS) with 34 samples over 22 hours and 20 minutes, driven by runway construction. Dallas/Fort Worth (DFW) had the most impactful ground delay program with 35 samples spanning almost 12 hours, presenting peak average delays of 169 minutes and peak maximum delays reaching 1387 minutes. Chicago O’Hare (ORD) had a
4-hour ground delay program led by rain and low ceilings. Austin (AUS) and Dallas Love Field (DAL) each had multi-hour ground delay programs due to thunderstorms. San Diego International (SAN) endured an 8 hour and 40-minute program linked to airport volume. San Francisco International (SFO) recorded a 4 hour and 20-minute delay program caused by low ceilings.
General Arrival/Departure Delay Info programs were less restrictive and covered airports such as Miami International (MIA) for 3 hours, Chicago O’Hare (ORD) nearly the full day for 22 hours and 20 minutes, Dallas/Fort Worth (DFW) for over 6 hours, and others including Fort
Lauderdale (FLL), San Diego (SAN), Dallas Love Field (DAL), and Harry Reid International (LAS), citing weather and traffic management initiatives as causes.
| Airport | FAA programme | Cause | Peak average delay | In force (UTC) |
|---|---|---|---|---|
| Dallas/Fort Worth International (DFW) | Ground Stop Programs | thunderstorms; VIP | – | 12:20 to 21:20 (9 hours) |
| Chicago O’Hare International (ORD) | Ground Stop Programs | rain; wind | – | 17:20 to 21:40 (4 hours 20 minutes) |
| Dallas Love Field (DAL) | Ground Stop Programs | thunderstorms | – | 13:00 to 17:00 (4 hours) |
| AUS | Ground Stop Programs | thunderstorms; THUNDERSTORMS | – | 16:40 to 20:40 (4 hours) |
| San Antonio International (SAT) | Ground Stop Programs | thunderstorms | – | 17:20 to 21:00 (3 hours 40 minutes) |
| San Francisco International (SFO) | Ground Stop Programs | low ceilings | – | 16:40 to 17:20 (40 minutes) |
| William P. Hobby (HOU) | Ground Stop Programs | thunderstorms | – | 17:40 to 18:20 (40 minutes) |
| George Bush Intercontinental (IAH) | Ground Stop Programs | thunderstorms | – | 17:40 to 18:20 (40 minutes) |
| Dallas/Fort Worth International (DFW) | Ground Delay Programs | thunderstorms; other | 169 min | 10:40 to 22:20 (11 hours 40 minutes) |
| AUS | Ground Delay Programs | thunderstorms | 127 min | 18:40 to 22:20 (3 hours 40 minutes) |
| Chicago O’Hare International (ORD) | Ground Delay Programs | rain; low ceilings | 104 min | 18:20 to 22:20 (4 hours) |
| Dallas Love Field (DAL) | Ground Delay Programs | thunderstorms | 74 min | 17:20 to 21:40 (4 hours 20 minutes) |
| Boston Logan International (BOS) | Ground Delay Programs | runway construction | 73 min | 00:00 to 22:20 (22 hours 20 minutes) |
| San Francisco International (SFO) | Ground Delay Programs | low ceilings | 48 min | 13:20 to 17:40 (4 hours 20 minutes) |
Thunderstorms and Weather Accounted for the Majority of Delay Causes
The top reasons cited by the FAA for delays on October 1 were thunderstorms, appearing 105 times among the sampled data, and closely followed by runway construction at 34 mentions. Weather-coded thunderstorms under other formats appeared an additional 30 times. Other frequent drivers included airport volume delays noted 27 times and low ceilings 19 times.
Thunderstorms prompted ground stops and delays at multiple Texas airports, including DFW, DAL, AUS, SAT, HOU, and IAH. This weather pattern was a
clear dominant cause across both ground stops and ground delay programs. Runway construction delays prolonged operations especially at Boston Logan, while airport volume influenced delays at San Diego. Low ceilings contributed to programs at SFO and ORD, alongside rain and wind primarily impacting Chicago O’Hare.
Delay Program Levels Slightly Higher Than Yesterday and Above Weekly Average
Compared with the previous day, October 1 recorded two more delay programs than the 25 documented the day before and affected two additional airports beyond the 15 impacted on September 30, 2026. The number of affected airports is also above the recent seven-day average of approximately 14, indicating elevated delay activity for this period. However,
October 1 is not the highest within this tracking window.
Methodology. travelandtournews.com samples the FAA’s National Airspace System status feed every 20 minutes throughout the US operating day and aggregates the result. This report is built from 67 samples taken between 00:00 and 22:20 UTC on 2026-10-01. Durations are the observed window between the first and last sample in which a programme was in force, so a programme’s true length may be slightly longer than shown. Ground stops, ground delay programmes, airport closures and general delays are all published by the FAA in real time; the daily aggregation is ours.