
On October 9, 2026, the FAA implemented 23 delay programs affecting 17 airports across the United States. The most heavily impacted airport was Boston Logan International (BOS), where peak delays reached 216 minutes under ongoing ground delay programs.
Airports and Delay Programmes across the United States
Among the 17 airports affected, the FAA issued three ground stop programs, eight ground delay programs, and twelve general arrival/departure delay infos. A ground stop holds departures bound for an airport on the ground at their origin; a ground delay program meters arrivals by assigning later departure times.
Austin-Bergstrom International Airport (AUS) experienced the longest single ground stop, lasting 1 hour and 20 minutes from 18:20 to 19:40 UTC, driven by airport volume. Seattle-Tacoma International (SEA) had a ground stop lasting 40 minutes early in the day caused by runway construction, while Harry Reid International (LAS) underwent a short 20-minute
ground stop due to wind conditions.
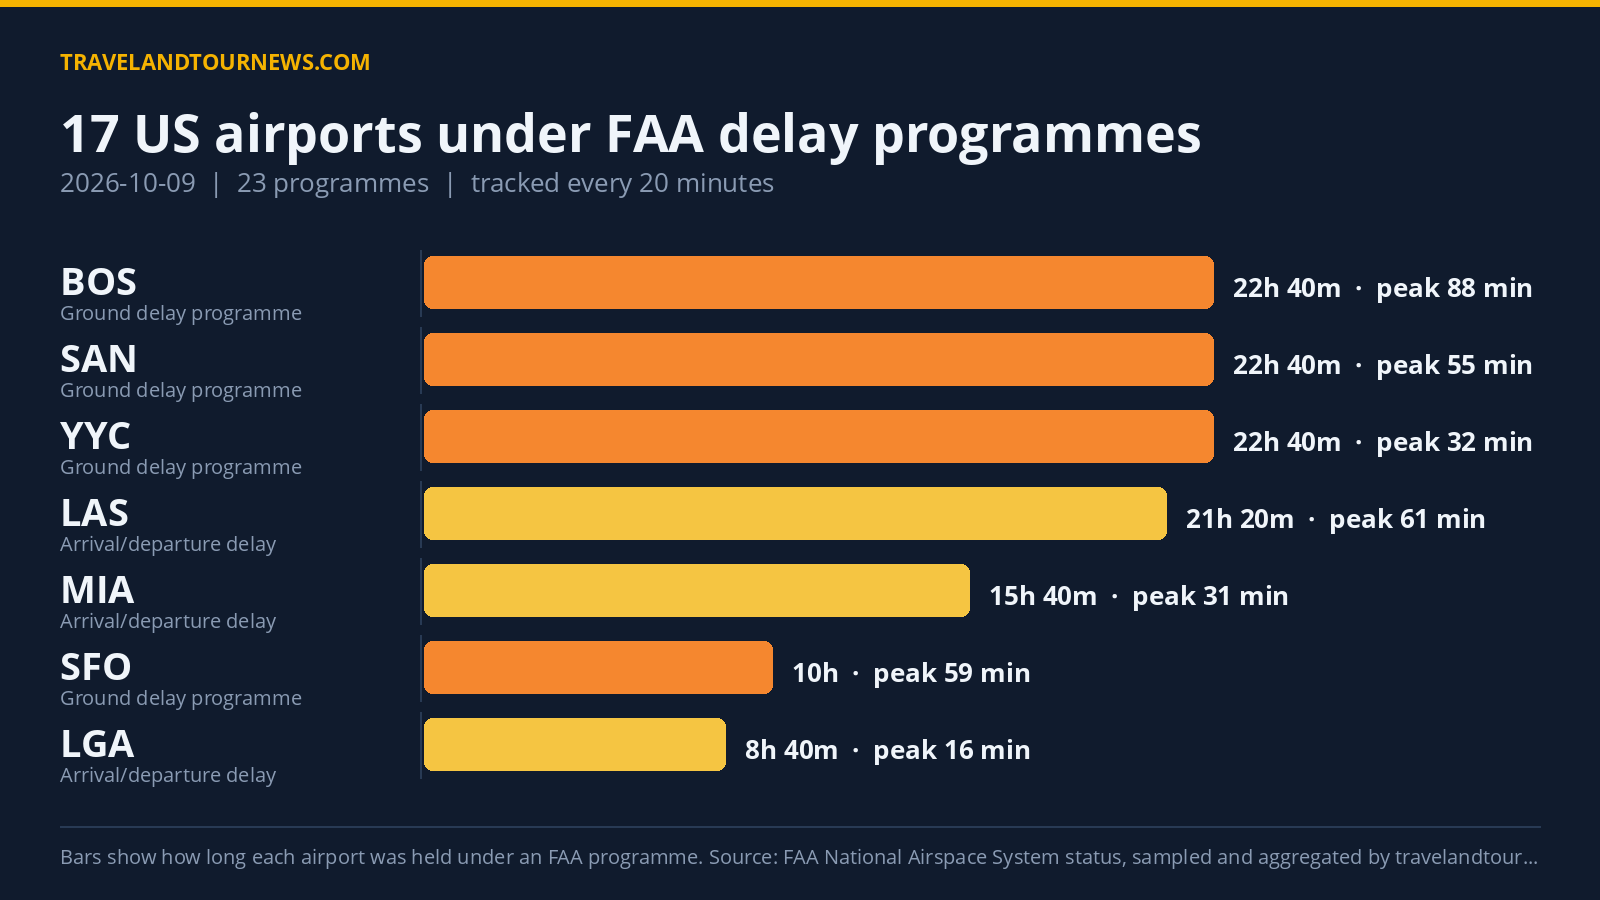
Boston Logan International (BOS) recorded the longest continuous ground delay program at 22 hours and 40 minutes, starting from midnight through 22:40 UTC. This ground delay program was attributed to runway construction and wind, with peak average delays of 88 minutes and a maximum peak delay of 216 minutes.
Other notable ground delay programs included San Francisco International (SFO), which had a 10-hour ground delay program from 12:40 to 22:40 UTC due to an air show and other causes, with peak delays up to 601 minutes. San Diego International (SAN) also had a near
full-day program citing low visibility and airport volume as reasons, with peak average delays of 55 minutes.
| Airport | FAA programme | Cause | Peak average delay | In force (UTC) |
|---|---|---|---|---|
| AUS | Ground Stop Programs | airport volume | – | 18:20 to 19:40 (1 hour 20 minutes) |
| Seattle-Tacoma International (SEA) | Ground Stop Programs | runway construction | – | 02:00 to 02:40 (40 minutes) |
| Harry Reid International (LAS) | Ground Stop Programs | wind | – | 21:40 to 21:40 (20 minutes) |
| Boston Logan International (BOS) | Ground Delay Programs | runway construction; wind | 88 min | 00:00 to 22:40 (22 hours 40 minutes) |
| Chicago O’Hare International (ORD) | Ground Delay Programs | other | 65 min | 21:00 to 22:40 (1 hour 40 minutes) |
| San Francisco International (SFO) | Ground Delay Programs | air show; other | 59 min | 12:40 to 22:40 (10 hours) |
| San Diego International (SAN) | Ground Delay Programs | LOW; airport volume | 55 min | 00:00 to 22:40 (22 hours 40 minutes) |
| Harry Reid International (LAS) | Ground Delay Programs | wind | 36 min | 22:00 to 22:40 (40 minutes) |
| John F. Kennedy International (JFK) | Ground Delay Programs | wind | 34 min | 00:00 to 00:40 (40 minutes) |
| YYC | Ground Delay Programs | runway construction; wind | 32 min | 00:00 to 22:40 (22 hours 40 minutes) |
| YUL | Ground Delay Programs | runway construction | 29 min | 17:20 to 22:40 (5 hours 20 minutes) |
| Harry Reid International (LAS) | General Arrival/Departure Delay Info | WX:Wind; OTHER:Aircraft Emergency | 61 min | 01:20 to 22:40 (21 hours 20 minutes) |
| TEB | General Arrival/Departure Delay Info | TM Initiatives:Metering:VOL; WX:Wind | 46 min | 14:20 to 22:40 (8 hours 20 minutes) |
| Miami International (MIA) | General Arrival/Departure Delay Info | TM Initiatives:MIT:WX; TM Initiatives:MIT:VOL | 31 min | 00:20 to 16:00 (15 hours 40 minutes) |
General arrival/departure delay information was also prevalent, including at Harry Reid International (LAS) over 21 hours and 20 minutes with causes citing wind and an aircraft emergency, and at Teterboro Airport (TEB) for over 8 hours due to metering initiatives and wind. Miami International (MIA) faced delays attributed to weather and volume mitigation initiatives spanning over 15 hours.
Wind and Airport Volume Were Leading Causes
Wind was the top driver, cited in 46 delay programs across the country. Airport volume accounted for 32 programs, making it the second most frequent cause. Runway construction and air shows each were noted causes in 30 programs.
Specific attributions included runway construction in Seattle (SEA), Boston (BOS), and Calgary (YYC), with wind effects also prominent at JFK, LAS, and other airports. Air shows impacted delays at San Francisco (SFO) and Ronald Reagan Washington National (DCA).
Comparing Delays to Previous Days
The number of affected airports on October
9 was 17, slightly above yesterday’s 16 and above the recent 7-day average of 13.4 airports under delay programs. Total programs increased by one from yesterday’s 22 to 23 today. This indicates a modest rise in operational restrictions but does not mark the highest levels in the recent tracking window.
FAA data tracked by travelandtournews.com provide these aggregated figures from the agency’s official delay feeds, sampled every 20 minutes throughout the date.
Methodology. travelandtournews.com samples the FAA’s National Airspace System status feed every 20 minutes throughout the US operating day and aggregates the result. This report is built from 69
samples taken between 00:00 and 22:40 UTC on 2026-10-09. Durations are the observed window between the first and last sample in which a programme was in force, so a programme’s true length may be slightly longer than shown. Ground stops, ground delay programmes, airport closures and general delays are all published by the FAA in real time; the daily aggregation is ours.