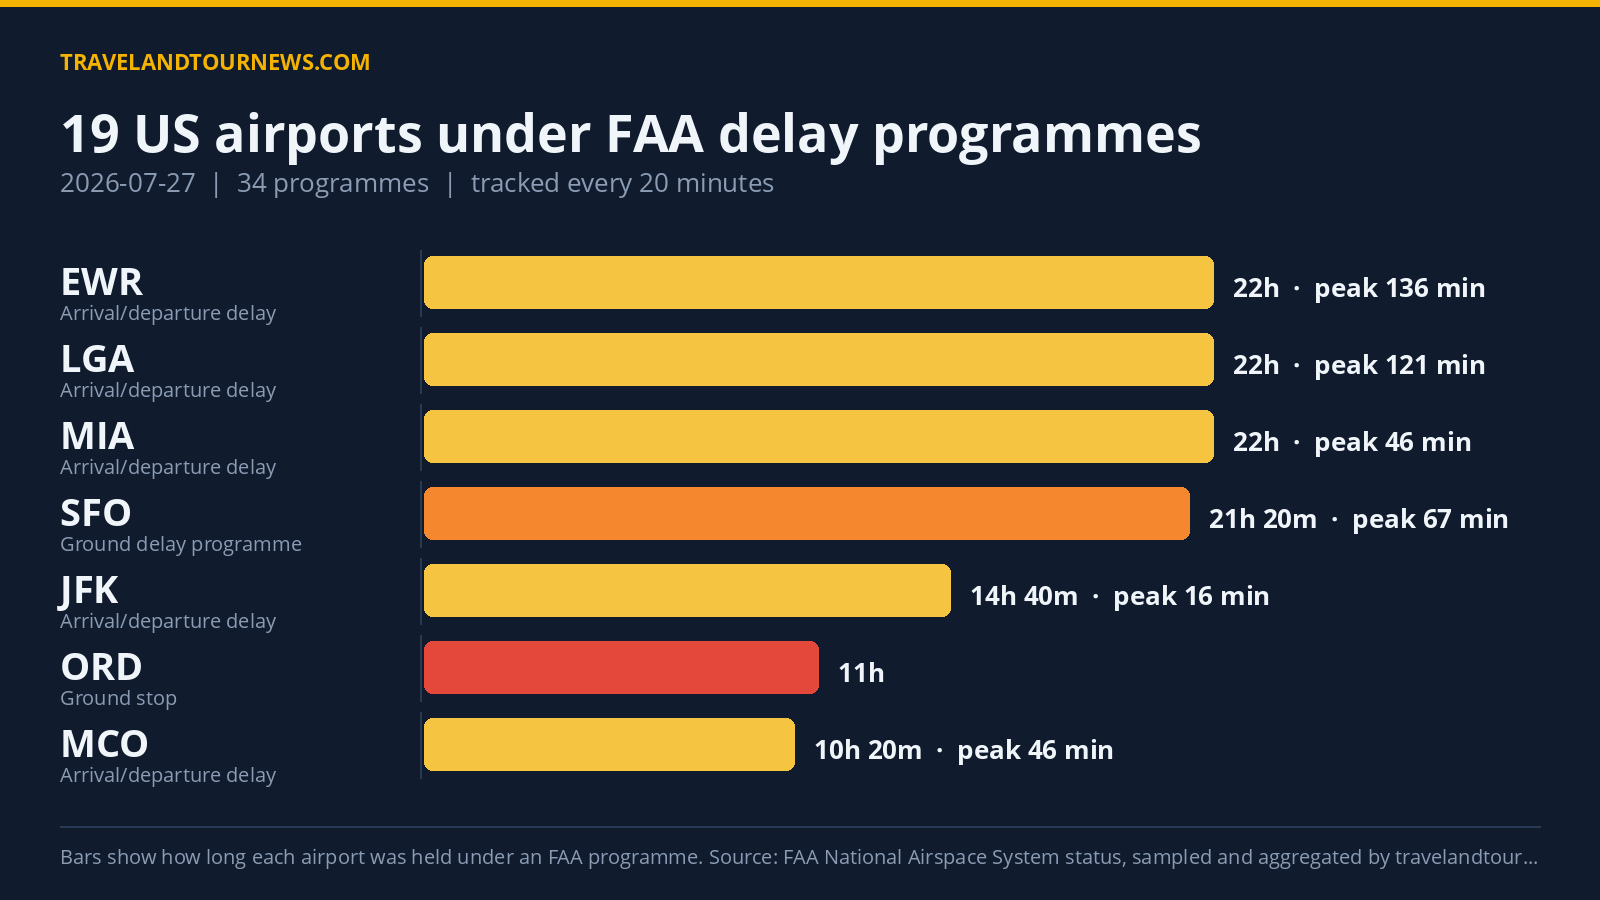

On July 27, 2026, the FAA monitored delay programmes affecting 19 United States airports with a total of 34 active programmes. Chicago O’Hare International Airport (ORD) was the worst affected, experiencing a peak maximum delay of 990 minutes according to FAA data tracked by travelandtournews.com.
FAA Delay Programmes Mainly Ground Stops and Ground Delays Lasted Hours
The FAA imposed 13 Ground Stop Programs that hold departures bound for specific airports at their origin and 7 Ground Delay Programs that assign later departure times to meter arrivals. Additionally, 14 General Arrival/Departure Delay Info programmes provided ongoing status updates.
ORD experienced the longest ground stop, lasting 11 hours from 11:00 to 22:00 UTC due to combined airspace volume and thunderstorms. This programme was supported by another ground delay programme at ORD due to thunderstorms lasting 6 hours, with an average delay peaking at 438 minutes.
Chicago Midway (MDW) operated a ground stop for 4 hours 40 minutes for
thunderstorms. In the New York region, LaGuardia (LGA), John F. Kennedy (JFK), and Newark (EWR) also had ground stop programmes mostly caused by staffing issues, lasting between 3 hours 20 minutes to 4 hours 40 minutes.
Other airports with ground stops included Tampa (TPA), Orlando (MCO), Atlanta (ATL), YUL, San Francisco (SFO), Toronto (YYZ), Washington Dulles (IAD), Austin (AUS), each facing delays from 20 minutes up to 2 hours, primarily due to thunderstorms or other operational reasons. Notably, Austin had a ground stop for 20 minutes caused by a disabled aircraft on the runway.
| Airport | FAA programme | Cause | Peak average delay | In force (UTC) |
|---|---|---|---|---|
| Chicago O’Hare International (ORD) | Ground Stop Programs | airspace volume; thunderstorms | – | 11:00 to 22:00 (11 hours) |
| Chicago Midway International (MDW) | Ground Stop Programs | thunderstorms | – | 17:20 to 22:00 (4 hours 40 minutes) |
| LaGuardia (LGA) | Ground Stop Programs | STAFFING | – | 17:20 to 22:00 (4 hours 40 minutes) |
| John F. Kennedy International (JFK) | Ground Stop Programs | STAFFING | – | 18:20 to 22:00 (3 hours 40 minutes) |
| Newark Liberty International (EWR) | Ground Stop Programs | STAFFING | – | 18:40 to 22:00 (3 hours 20 minutes) |
| Tampa International (TPA) | Ground Stop Programs | thunderstorms | – | 13:40 to 15:40 (2 hours) |
| Orlando International (MCO) | Ground Stop Programs | thunderstorms | – | 18:40 to 20:20 (1 hour 40 minutes) |
| Hartsfield-Jackson Atlanta International (ATL) | Ground Stop Programs | thunderstorms | – | 14:00 to 15:00 (1 hour) |
| YUL | Ground Stop Programs | thunderstorms | – | 20:40 to 21:40 (1 hour) |
| San Francisco International (SFO) | Ground Stop Programs | airport volume | – | 05:20 to 06:00 (40 minutes) |
| YYZ | Ground Stop Programs | thunderstorms | – | 19:00 to 19:40 (40 minutes) |
| Washington Dulles International (IAD) | Ground Stop Programs | thunderstorms | – | 20:00 to 20:40 (40 minutes) |
| AUS | Ground Stop Programs | disabled aircraft on the runway | – | 17:40 to 17:40 (20 minutes) |
| Chicago O’Hare International (ORD) | Ground Delay Programs | thunderstorms | 438 min | 16:00 to 22:00 (6 hours) |
Thunderstorms and Staffing Drove the Majority of Delay Programmes
The leading causes of the FAA
delay programmes on July 27 were varied but dominated by weather-related issues and staffing shortages. The most frequent cause was classified as “other,” with 107 occurrences. Thunderstorms accounted for 78 mentions, including 44 explicit references to “WX:Thunderstorms.”
Traffic management initiatives, often related to weather mitigation, accounted for 61 mentions under the category “TM Initiatives:SWAP:WX.” Staffing issues remained a major factor with 34 mentions, especially impacting the New York airports’ ground stop programmes. Chicago O’Hare’s ground stops were particularly affected by airspace volume in addition to thunderstorms.
Delay Activity Rises from Yesterday and Stays Above Weekly Average
Compared to the previous day, the number of airports under delay programmes increased by
8, from 11 to 19. Total programmes more than doubled from 15 to 34. The affected airport count on July 27 is also above the recent 7-day average of 16.3 airports per day, indicating heightened delay activity. Despite this increase, July 27 was not the worst day in the tracking window.
Methodology. travelandtournews.com samples the FAA’s National Airspace System status feed every 20 minutes throughout the US operating day and aggregates the result. This report is built from 67 samples taken between 00:00 and 22:00 UTC on 2026-07-27. Durations are the observed window between the first and last sample in
which a programme was in force, so a programme’s true length may be slightly longer than shown. Ground stops, ground delay programmes, airport closures and general delays are all published by the FAA in real time; the daily aggregation is ours.