
On September 9, 2026, the FAA held 9 United States airports under 10 separate delay programmes. Miami International Airport (MIA) was the worst hit, with a peak maximum delay of 985 minutes during its ground delay programme.
Delay Programmes by Airport and Duration
The delay programmes included one Ground Stop, two Ground Delay Programmes, and seven General Arrival/Departure Delay Info issuances. Ground stops hold departures bound for an airport on the ground at their origin, while ground delay programmes meter arrivals by assigning later departure times.
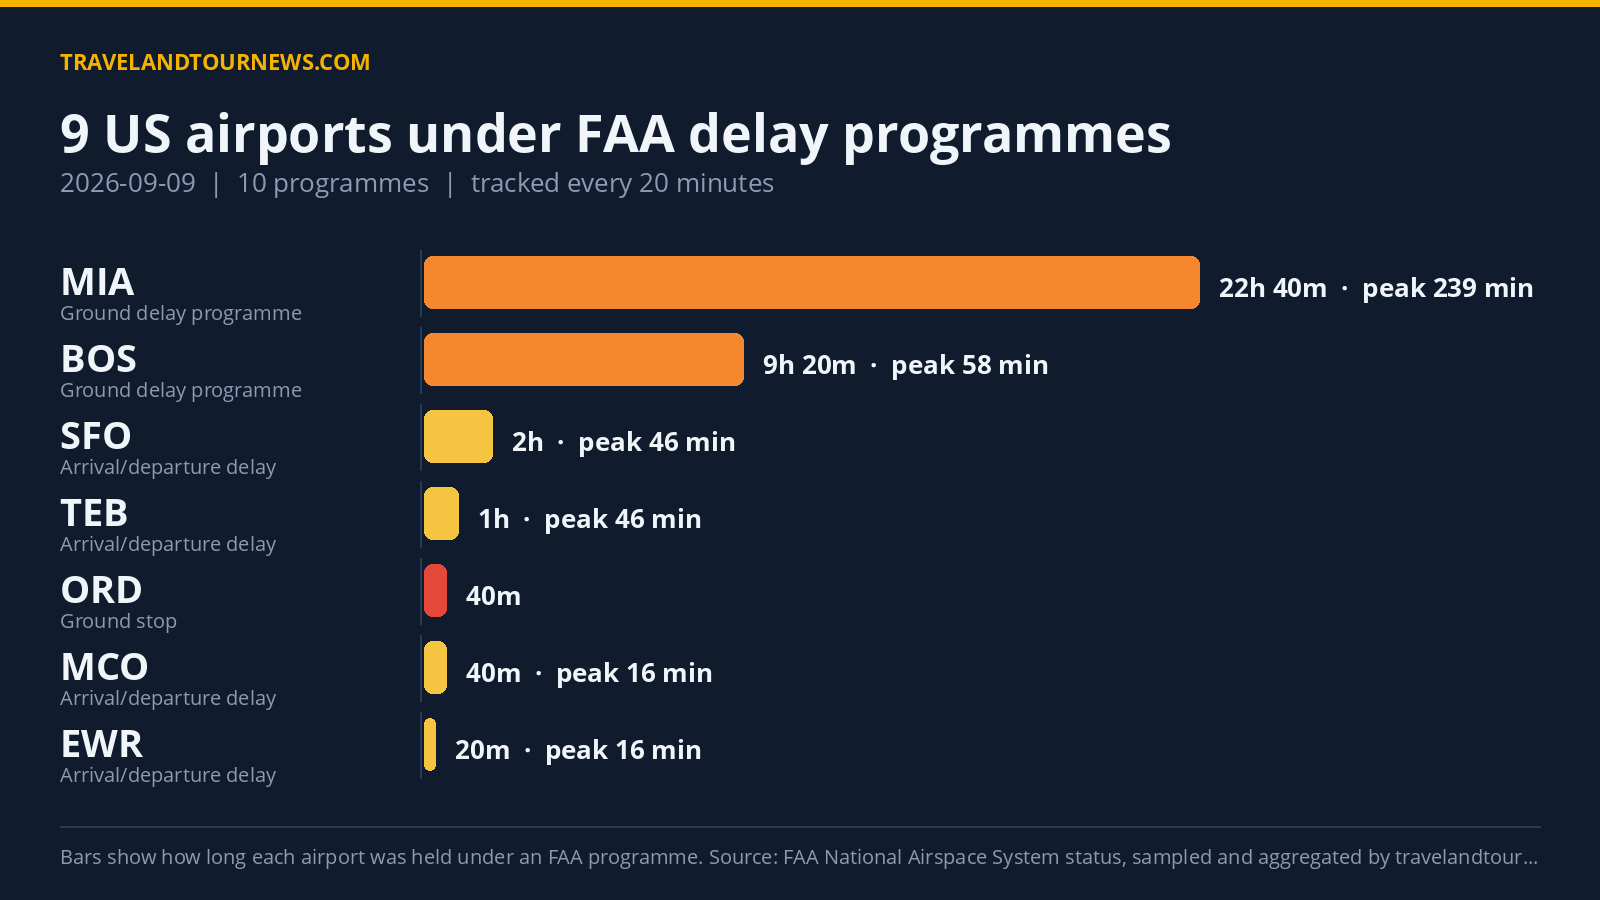
Chicago O’Hare International (ORD) experienced the sole Ground Stop programme from 20:40 to 21:20 UTC, lasting 40 minutes. This was followed later by a General Arrival/Departure Delay Info programme at ORD, due to volume, lasting 20 minutes with up to 30 minutes delay. Miami International (MIA) had a Ground Delay Programme active for 22 hours and 40
minutes, from 00:00 to 22:40 UTC, with peak average delay of 239 minutes and peak maximum delay reaching 985 minutes, caused by a disabled aircraft on the runway.
Boston Logan International (BOS) was also under a Ground Delay Programme from 13:20 to 22:40 UTC, lasting 9 hours and 20 minutes, due to runway construction. Its peak average delay was 58 minutes, with a maximum delay of 151 minutes.
Other airports with General Arrival/Departure Delay Info programmes include San Francisco International (SFO) for 2 hours due to runway construction, Teterboro Airport (TEB) for 1 hour due to traffic management weather initiatives,
Orlando International (MCO) for 40 minutes due to weather-related traffic management initiatives, Newark Liberty International (EWR) for 20 minutes due to traffic management volume stoppage, George Bush Intercontinental (IAH) for 20 minutes caused by thunderstorms, and Dallas/Fort Worth International (DFW) for 20 minutes linked to VIP movements.
| Airport | FAA programme | Cause | Peak average delay | In force (UTC) |
|---|---|---|---|---|
| Chicago O’Hare International (ORD) | Ground Stop Programs | OCL: | – | 20:40 to 21:20 (40 minutes) |
| Miami International (MIA) | Ground Delay Programs | disabled aircraft on the runway | 239 min | 00:00 to 22:40 (22 hours 40 minutes) |
| Boston Logan International (BOS) | Ground Delay Programs | runway construction | 58 min | 13:20 to 22:40 (9 hours 20 minutes) |
| San Francisco International (SFO) | General Arrival/Departure Delay Info | RWY:Construction | 46 min | 18:20 to 20:20 (2 hours) |
| TEB | General Arrival/Departure Delay Info | TM Initiatives:SWAP:WX | 46 min | 21:40 to 22:40 (1 hour) |
| Orlando International (MCO) | General Arrival/Departure Delay Info | TM Initiatives:MIT:WX | 16 min | 20:20 to 21:00 (40 minutes) |
| Newark Liberty International (EWR) | General Arrival/Departure Delay Info | TM Initiatives:STOP:VOL | 16 min | 14:00 to 14:20 (20 minutes) |
| George Bush Intercontinental (IAH) | General Arrival/Departure Delay Info | WX:Thunderstorms | 16 min | 20:40 to 20:40 (20 minutes) |
| Dallas/Fort Worth International (DFW) | General Arrival/Departure Delay Info | VIPM:VIP Movement | 16 min | 21:40 to 22:00 (20 minutes) |
| Chicago O’Hare International (ORD) | General Arrival/Departure Delay Info | VOL:Volume | 16 min | 22:20 to 22:40 (20 minutes) |
Primary Delay Causes Across Programmes
The leading cause behind delay programmes was a disabled aircraft on the runway, responsible for 27 samples all at Miami International. The second most frequent cause was runway construction, which contributed to 18 samples including Boston Logan and San Francisco International. Other causes included traffic management initiatives related to weather—accounting for seven samples—and
volume-related restrictions and VIP movements, which appeared in fewer instances.
Comparison with Previous Day and Weekly Average
Compared to September 8, 2026, there was a slight decrease in activity with one fewer delay programme (10 versus 14) and one fewer airport affected (9 versus 10). The number of airports affected on September 9 remains well below the seven-day average of 17.4 airports impacted daily. None of the delay programmes observed on September 9 reached the highest delay levels recorded in the recent tracking window.
Methodology. travelandtournews.com samples the FAA’s National Airspace System status feed every 20 minutes throughout the US operating day and aggregates the result. This
report is built from 58 samples taken between 00:00 and 22:40 UTC on 2026-09-09. Durations are the observed window between the first and last sample in which a programme was in force, so a programme’s true length may be slightly longer than shown. Ground stops, ground delay programmes, airport closures and general delays are all published by the FAA in real time; the daily aggregation is ours.