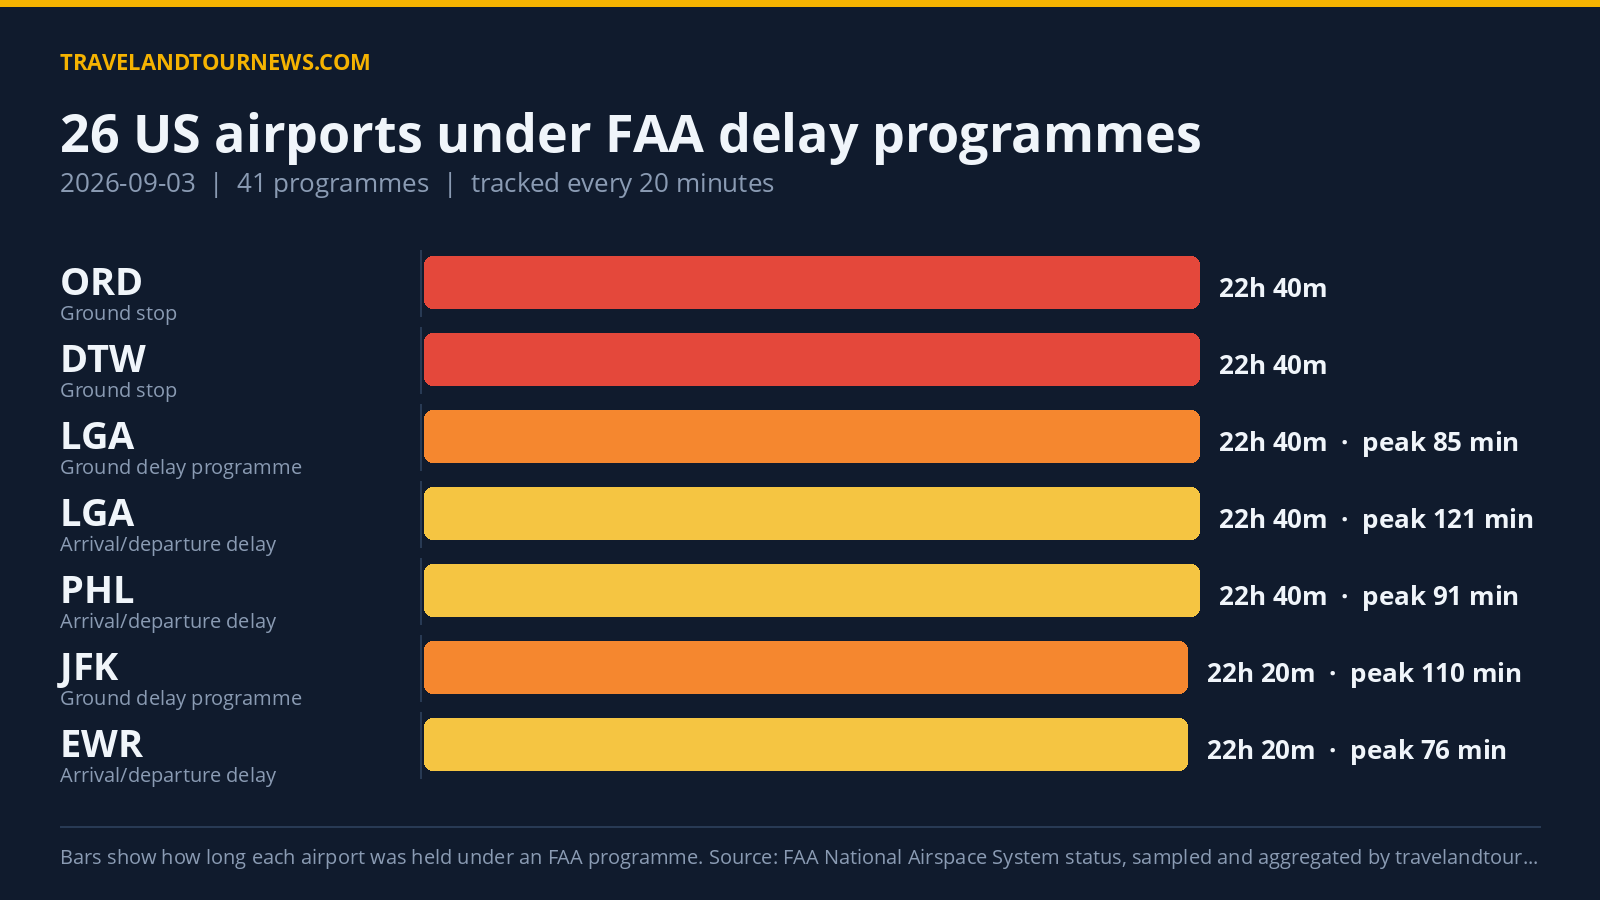

On September 3, 2026, the FAA held 26 US airports under a total of 41 delay programmes. Chicago O’Hare International (ORD) was the worst affected airport, experiencing ground stop programmes lasting nearly 23 hours due to thunderstorms and airspace volume.
Delays Targeted 26 Airports with 41 Total FAA Programmes
FAA delay programmes on September 3 included 13 ground stop programmes, 7 ground delay programmes, and 21 general arrival or departure delay notices. A ground stop holds departures bound for an airport on the ground at their origin, while a ground delay programme meters arrivals by assigning later departure times.
Chicago O’Hare’s ground stop remained active from 00:00 to 22:40 UTC, spanning 22 hours and 40 minutes. Detroit Metropolitan Wayne County (DTW) had ground stops lasting similarly long, also attributed to thunderstorms. LaGuardia (LGA) held the longest-running ground delay programme, active for 22 hours and 40 minutes, with peak average
delays of 85 minutes and maximum delays reaching 468 minutes.
Other major ground delay programmes included John F. Kennedy International (JFK), active nearly the entire day with 22 hours and 20 minutes observed, showing peak average delays of 110 minutes. Boston Logan International (BOS) and San Francisco International (SFO) had ground delay programmes lasting over 8 hours due to low ceilings, with peak average delays of 136 and 81 minutes respectively.
| Airport | FAA programme | Cause | Peak average delay | In force (UTC) |
|---|---|---|---|---|
| Chicago O’Hare International (ORD) | Ground Stop Programs | thunderstorms; airspace volume | – | 00:00 to 22:40 (22 hours 40 minutes) |
| Detroit Metropolitan Wayne County (DTW) | Ground Stop Programs | thunderstorms; THUNDERSTORMS | – | 00:00 to 22:40 (22 hours 40 minutes) |
| LaGuardia (LGA) | Ground Stop Programs | thunderstorms; bird strike | – | 00:00 to 13:20 (13 hours 20 minutes) |
| Chicago Midway International (MDW) | Ground Stop Programs | thunderstorms | – | 00:00 to 03:00 (3 hours) |
| Philadelphia International (PHL) | Ground Stop Programs | thunderstorms | – | 10:00 to 13:00 (3 hours) |
| Boston Logan International (BOS) | Ground Stop Programs | thunderstorms | – | 00:00 to 02:00 (2 hours) |
| YUL | Ground Stop Programs | airport volume | – | 00:00 to 00:40 (40 minutes) |
| Newark Liberty International (EWR) | Ground Stop Programs | thunderstorms | – | 12:00 to 12:20 (20 minutes) |
| Baltimore/Washington International (BWI) | Ground Stop Programs | thunderstorms | – | 15:00 to 15:00 (20 minutes) |
| Ronald Reagan Washington National (DCA) | Ground Stop Programs | thunderstorms | – | 15:00 to 15:00 (20 minutes) |
| Washington Dulles International (IAD) | Ground Stop Programs | thunderstorms | – | 15:00 to 15:00 (20 minutes) |
| George Bush Intercontinental (IAH) | Ground Stop Programs | thunderstorms | – | 19:20 to 19:40 (20 minutes) |
| William P. Hobby (HOU) | Ground Stop Programs | thunderstorms | – | 21:20 to 21:20 (20 minutes) |
| YYZ | Ground Delay Programs | thunderstorms | 298 min | 00:00 to 03:00 (3 hours) |
Thunderstorms and Weather Initiatives Dominated Delay Causes
The FAA’s official reasons for delays clustered around thunderstorms, weather initiatives, and airspace or airport volume. “TM Initiatives:SWAP:WX”—an air traffic management initiative tied to weather—was the cause behind 112
logged delay observations. Thunderstorms directly accounted for 109 mentions, and related weather conditions such as low ceilings were cited 26 times.
Airport volume contributed to delays in 25 programme samples. Chicago O’Hare experienced the combined effect of thunderstorms and high airspace volume. LaGuardia’s ground stop combined thunderstorms with a bird strike event early in the day.
Delay programmes tied specifically to thunderstorms appeared across many airports, including Detroit, Boston, Philadelphia, and Newark. Some airports, such as Montreal’s YUL, cited airport volume as the reason for their shorter ground stops.
Delays Exceeded Yesterday and Weekly Averages
The FAA’s delay tracking shows this September 3 affected more airports
and involved more programmes than yesterday and the seven-day average. Today’s total of 26 airports under delay programmes is 7 more than yesterday’s 19 and above the average of 19.4.
With 41 programmes recorded, the number is also higher than yesterday’s 34. The current level constitutes the highest number of airports affected in the past week’s tracking window.
All data is based on the FAA’s official delay feed, tracked and aggregated by travelandtournews.com.
Methodology. travelandtournews.com samples the FAA’s National Airspace System status feed every 20 minutes throughout the US operating day and aggregates the result. This report is built from
55 samples taken between 00:00 and 22:40 UTC on 2026-09-03. Durations are the observed window between the first and last sample in which a programme was in force, so a programme’s true length may be slightly longer than shown. Ground stops, ground delay programmes, airport closures and general delays are all published by the FAA in real time; the daily aggregation is ours.