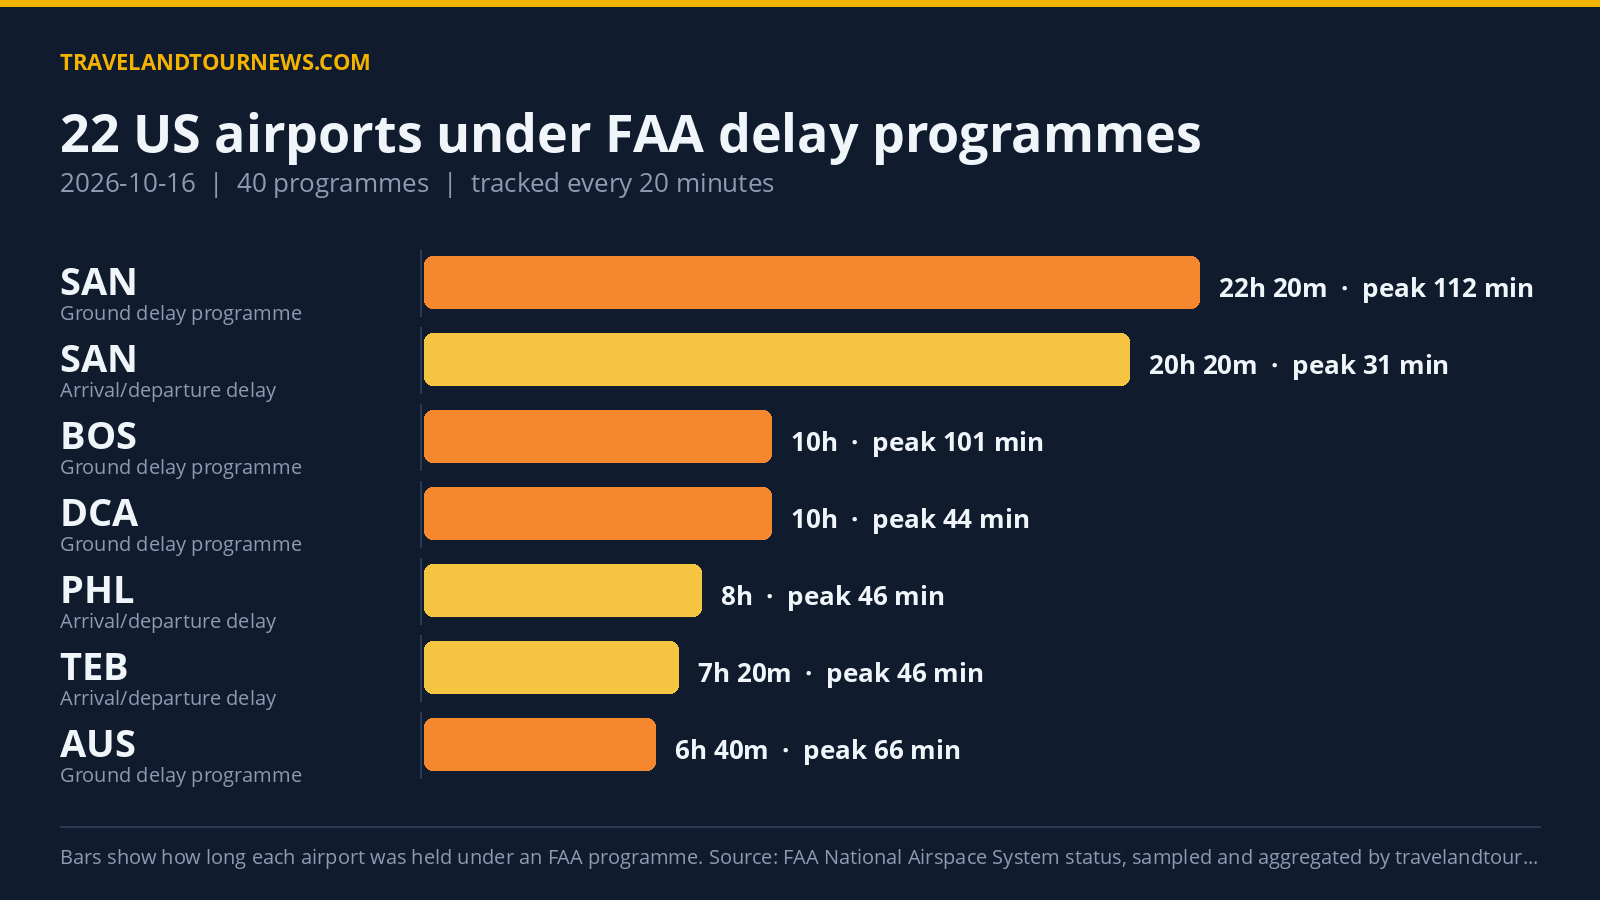

On October 16, 2026, the Federal Aviation Administration (FAA) held delay programmes affecting 22 airports across the United States. There were 40 programmes total, with San Diego International (SAN) identified as the worst-hit airport, experiencing peak delays of up to 245 minutes.
Airport Delay Programmes and Peak Figures
Among the 22 affected airports, the FAA issued 13 Ground Stop Programs, 14 Ground Delay Programs, and 13 General Arrival/Departure Delay notices. A Ground Stop holds departures bound for the airport on the ground at their origin, while a Ground Delay Programme meters arrivals by assigning later departure times.
San Diego (SAN) faced the longest single delay programme with its Ground Delay Programme spanning 22 hours and 20 minutes, from 00:00 to 22:20 UTC. This programme recorded a peak average delay of 112 minutes and a peak maximum delay of 245 minutes. Additionally, SAN had a Ground Stop Programme lasting
3 hours from 16:00 to 19:00 UTC.
Boston Logan International (BOS) experienced a Ground Delay Programme related to low ceilings lasting 10 hours with peak delays reaching 490 minutes maximum. Chicago O’Hare International (ORD) had a Ground Delay Programme lasting 2 hours and 40 minutes with peak average delays of 81 minutes.
Other notable Ground Delay Programmes included Harry Reid International (LAS) for wind delays over 5 hours and 40 minutes, Philadelphia International (PHL) for thunderstorms over 6 hours and 20 minutes, and Dallas/Fort Worth International (DFW) with thunderstorm-related delays lasting 2 hours and 40 minutes. Ground Stop Programs, while
typically shorter, were issued across multiple airports including Seattle-Tacoma (SEA) and Newark Liberty International (EWR) for issues such as runway construction and thunderstorms.
| Airport | FAA programme | Cause | Peak average delay | In force (UTC) |
|---|---|---|---|---|
| San Diego International (SAN) | Ground Stop Programs | wind; airport departure volume | – | 16:00 to 19:00 (3 hours) |
| TEB | Ground Stop Programs | thunderstorms | – | 21:20 to 22:20 (1 hour) |
| Chicago O’Hare International (ORD) | Ground Stop Programs | thunderstorms | – | 00:00 to 00:40 (40 minutes) |
| Seattle-Tacoma International (SEA) | Ground Stop Programs | runway construction | – | 02:20 to 03:00 (40 minutes) |
| Harry Reid International (LAS) | Ground Stop Programs | runway maintenance | – | 19:20 to 20:00 (40 minutes) |
| Philadelphia International (PHL) | Ground Stop Programs | thunderstorms | – | 21:20 to 22:00 (40 minutes) |
| Dallas/Fort Worth International (DFW) | Ground Stop Programs | wind | – | 02:20 to 02:40 (20 minutes) |
| AUS | Ground Stop Programs | runway construction | – | 15:00 to 15:00 (20 minutes) |
| Minneapolis-Saint Paul International (MSP) | Ground Stop Programs | wind | – | 18:00 to 18:20 (20 minutes) |
| Boston Logan International (BOS) | Ground Stop Programs | low ceilings | – | 19:40 to 19:40 (20 minutes) |
| Washington Dulles International (IAD) | Ground Stop Programs | thunderstorms | – | 22:20 to 22:20 (20 minutes) |
| Ronald Reagan Washington National (DCA) | Ground Stop Programs | low ceilings | – | 22:20 to 22:20 (20 minutes) |
| Newark Liberty International (EWR) | Ground Stop Programs | thunderstorms | – | 22:20 to 22:20 (20 minutes) |
| San Diego International (SAN) | Ground Delay Programs | airport volume; wind | 112 min | 00:00 to 22:20 (22 hours 20 minutes) |
Thunderstorms and Weather Drove Most Delays
The leading cause of delay programmes on October 16 was thunderstorms, cited 66 times across multiple airports. Low ceilings were the second-highest cause at 62 mentions, closely followed by wind-related issues at 41 occurrences. Other common reasons included traffic management initiatives linked to weather and runway construction or maintenance.
Thunderstorms, low ceilings, and wind jointly accounted for the majority of delay programmes, impacting busy hubs such as San Diego, Boston, Philadelphia, and Dallas/Fort Worth. Runway construction and
maintenance were also significant contributors, particularly at Austin (AUS), Seattle (SEA), and YUL.
Increased Delays Compared to Previous Days
Compared with the previous day, October 15, there was a noticeable increase in disruptions. The number of airports affected rose from 16 to 22, while total delay programmes doubled from 20 to 40. This represents an increase of 6 airports affected over the prior day and twice as many delay programmes.
When compared to the seven-day average of 16.4 airports affected per day, October 16 also stands out as having the highest number of affected airports in the tracking window. The extended duration and peak delays, especially
at San Diego and Boston, contributed to the significant rise in delay impact on this date.
Methodology. travelandtournews.com samples the FAA’s National Airspace System status feed every 20 minutes throughout the US operating day and aggregates the result. This report is built from 67 samples taken between 00:00 and 22:20 UTC on 2026-10-16. Durations are the observed window between the first and last sample in which a programme was in force, so a programme’s true length may be slightly longer than shown. Ground stops, ground delay programmes, airport closures and general delays are all published by the FAA in real
time; the daily aggregation is ours.